ProxMenux Monitor
A self-hosted web dashboard for Proxmox VE shipped as an AppImage. It runs on the host as a single systemd service, listens on TCP 8008, and serves both the API and the UI from one process.
At a glance
psutil, pvesh, smartctl, journalctl → Next.js dashboard served from the same process. Optional auth (password + 2FA), optional AI assistant, optional notifications, REST API for integrations.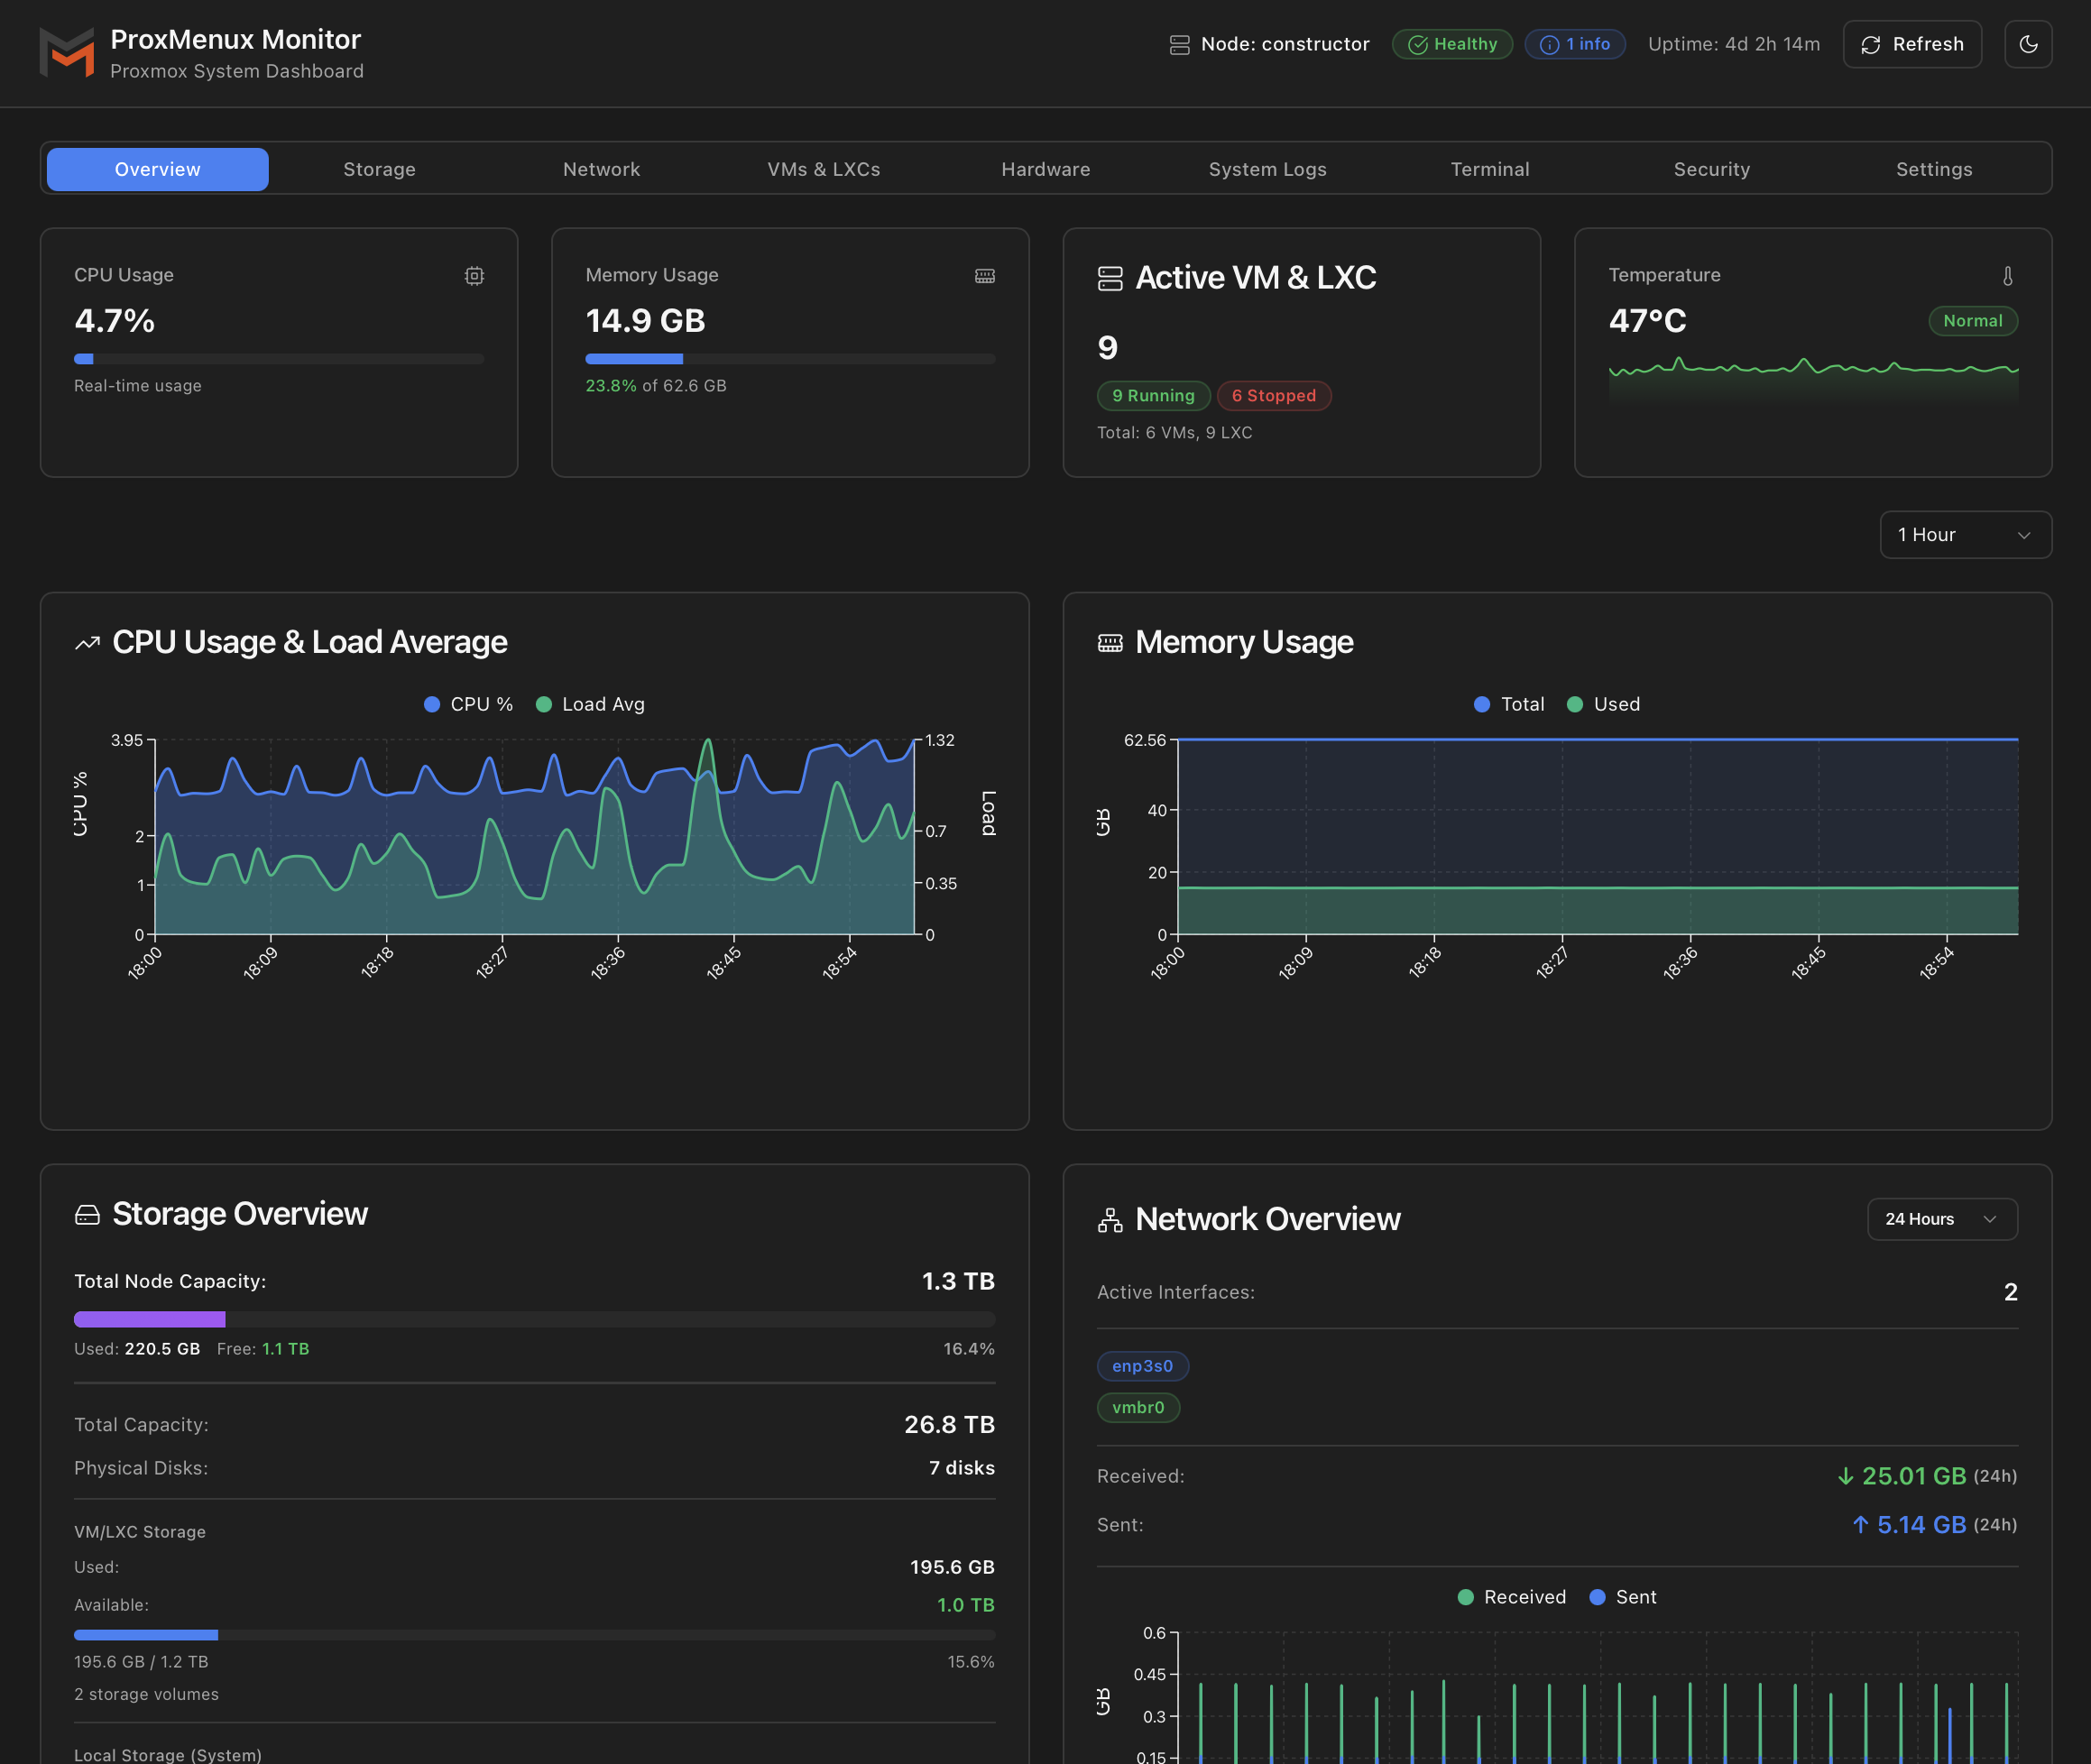
What the dashboard covers
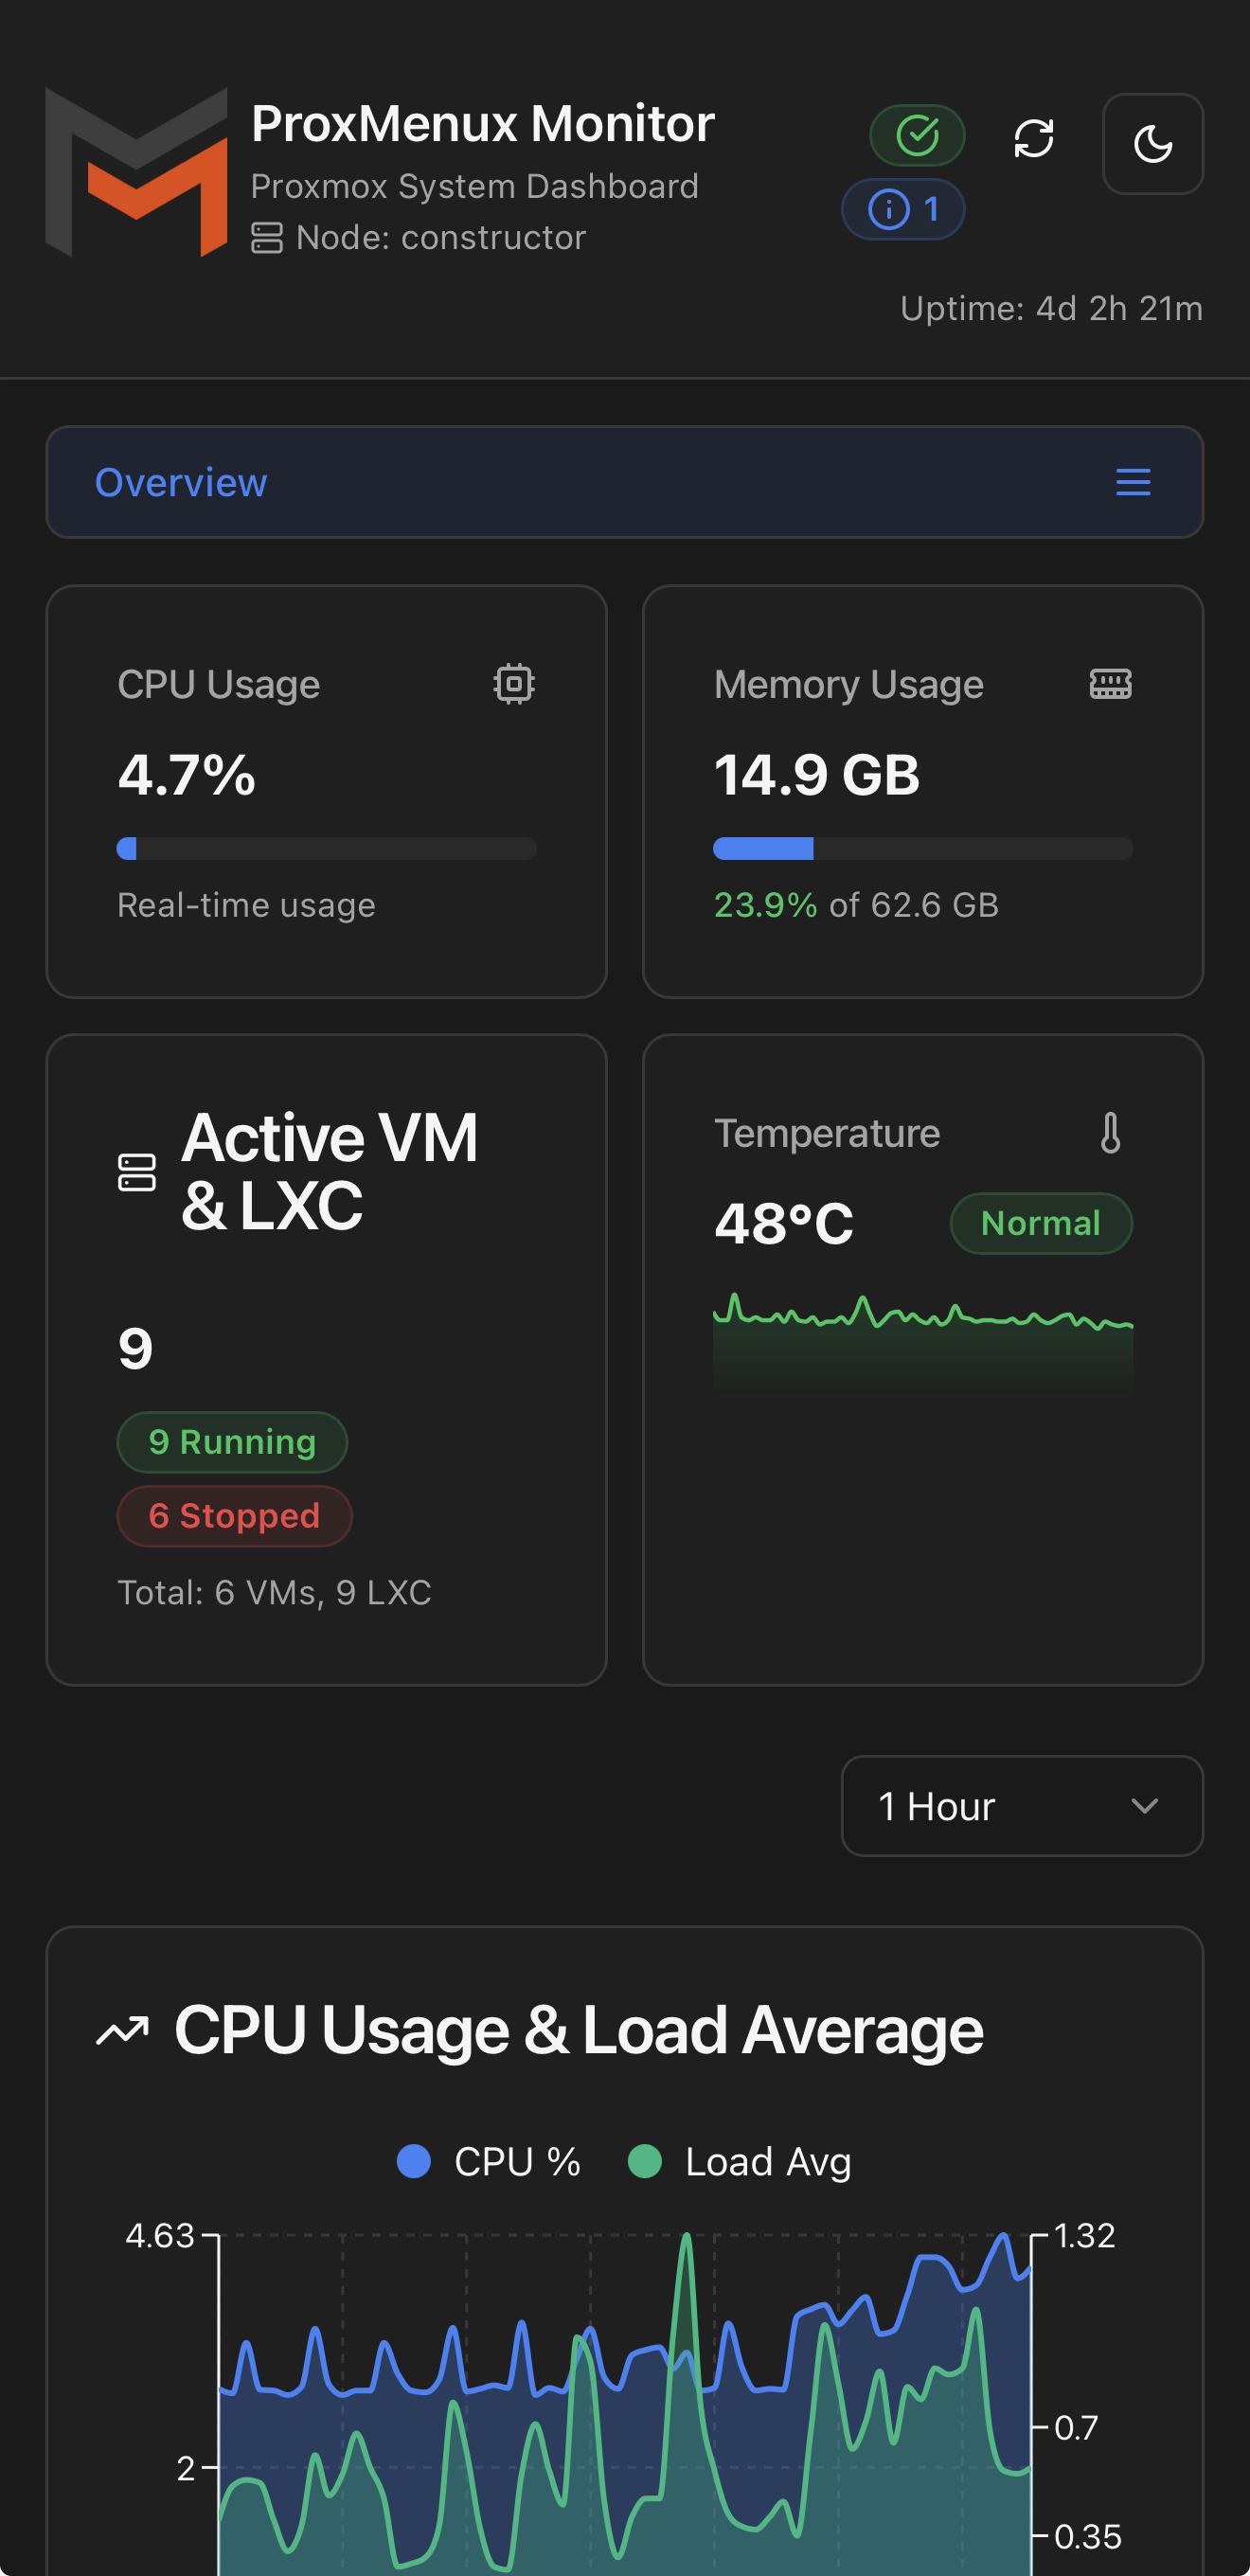
Eight first-class sections, each backed by its own API endpoints:
| Section | What it shows |
|---|---|
| Health Monitor | Active and dismissed alerts across CPU, memory, storage, disks, network, services, logs, VMs, updates and security. Drives the notification engine. |
| Storage | Proxmox storage pools, physical disks (SATA / NVMe / USB), SMART attributes, ZFS pool status, wear & lifetime, I/O activity. |
| Network | All interfaces (physical, bonds, bridges, OVS), IP/MAC/state, real-time RX/TX graphs, historical RRD data per interface. |
| VMs & Containers | Inventory of all VMs and LXCs with status, resources and uptime. Drill-in shows config, historical metrics, full guest logs and start/stop/reboot/shutdown actions. |
| Hardware | CPU model and topology, memory layout, PCIe devices, GPU list with driver and per-slot real-time monitoring (NVIDIA / Intel iGPU). |
| Logs & Events | Live journalctl with severity / time-range / keyword filters, Proxmox task history, notification log, downloadable log bundles. |
| Terminal | Browser shell to the host or to any VM/CT, powered by xterm.js over WebSockets. Authenticated and audited like the rest of the API. |
| Security | Authentication failures, Fail2Ban jail status, recent ban events, integration with the host's [proxmenux] jail. |
Every section has a dedicated documentation page under Dashboard in the sidebar.
How it runs
ProxMenux Monitor ships as a self-contained AppImage. A single systemd unit (proxmenux-monitor.service) starts a Flask process that:
- Listens on TCP 8008 on the host (HTTP).
- Serves the Next.js dashboard as static assets under
/and the API under/api/*from the same process. - Pulls live data with standard host tools:
psutil,pvesh,smartctl,journalctl,zpool,ip,nvidia-smi, etc. - Persists its own state in a local SQLite database (
/usr/local/share/proxmenux/health_monitor.db): dismissed alerts, disk observations, notification config, AI config. Authentication state lives separately in/root/.config/proxmenux-monitor/auth.json.
The full request flow, file layout and the systemd integration are described in Architecture.
No agent on the guests
Accessing the dashboard
Two access patterns are supported and the application detects which one is in use:
# 1) Direct access on the host
http://<your-proxmox-ip>:8008

# 2) Via reverse proxy (Nginx / Caddy / Traefik)
https://<your-domain>/proxmenux-monitor/
When fronted by a reverse proxy, the Monitor honours X-Forwarded-For, X-Forwarded-Proto and X-Forwarded-Host so URLs and CORS behave correctly without manual configuration.
First-launch setup, password + TOTP 2FA, and reverse-proxy snippets are covered in Access & Authentication.
Mobile use and home-screen install
The dashboard is responsive and ships as a Progressive Web App. The packaged public/manifest.json declares display: standalone with an app name, icon and theme colour, so adding the URL to the home screen produces a real standalone launcher — no browser address bar, custom splash, dark theme matched to the dashboard.
Add to home screen
- iOS Safari: share button → Add to Home Screen. The icon comes from
/apple-touch-icon.pngshipped in the AppImage. - Android Chrome / Edge: three-dot menu → Install app (or Add to Home screen on older versions).
- Once installed, opening the icon launches the dashboard in standalone mode with its own task switcher entry.
Online-only
The Health Monitor and notifications
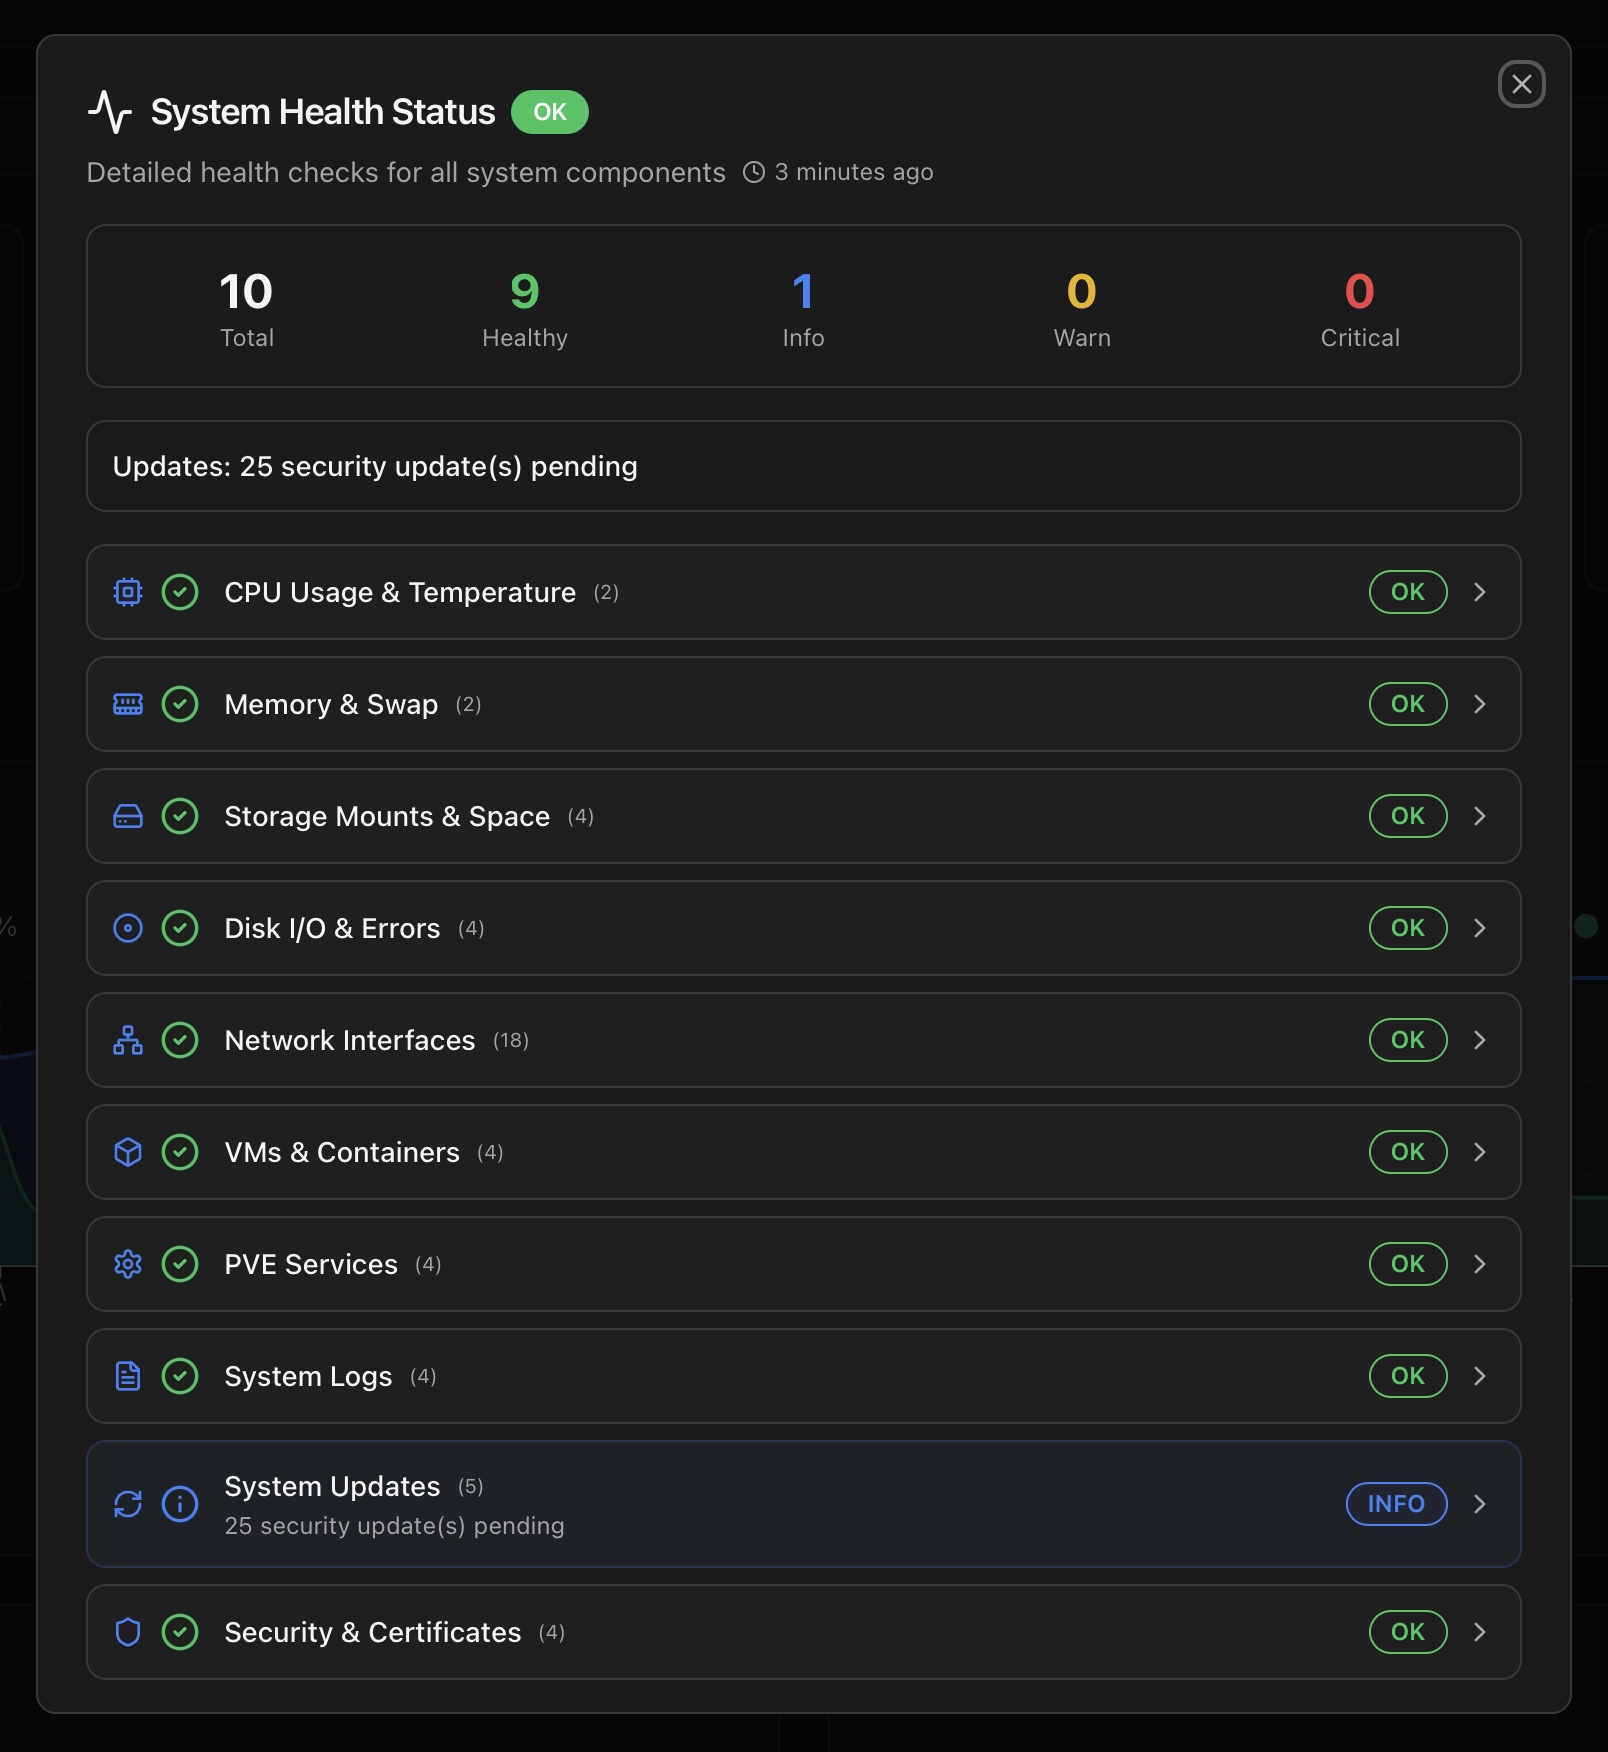
Inside the dashboard, the Health Monitor runs continuously in the background and produces a structured stream of events: high CPU temperature, disk SMART warnings, ZFS pool degradation, OOM kills, VM/CT failures, security incidents, and so on. Each event has a category, a severity (INFO / WARNING / CRITICAL) and a stable error_key so duplicates collapse instead of flooding the screen.
Events feed three things at the same time:
- The Health Monitor view in the dashboard (active + dismissed lists).
- The notification engine — Telegram, Discord, Email, Gotify and Apprise (multi-channel). Each channel is configured independently and per-event categories can be silenced.
- The optional AI assistant — when enabled, the configured provider (OpenAI, Anthropic, Gemini, Groq, Ollama or OpenRouter) explains incoming events in plain language and, if enabled in the AI settings, proposes next steps.
Suppression instead of mute-all
REST API and integrations
Everything the UI shows is available as JSON over HTTP/HTTPS. The same endpoints power Homepage widgets, Home Assistant sensors, Grafana dashboards (via the Prometheus exporter at /api/prometheus), Uptime Kuma probes and any custom script that speaks curl.
- Long-lived API tokens (365 days) are generated from Settings → API Access Tokens or via
POST /api/auth/generate-api-token. - Tokens travel as
Authorization: Bearer …. Public endpoints (/api/health,/api/auth/*) work without a token so external uptime probes can hit the host without handing out credentials. - The full endpoint catalog, token rotation guidance and security best-practices live in API Reference; ready-made examples for Homepage, Home Assistant, Grafana, Uptime Kuma and a generic cURL pattern are in Integrations.
Service control
Day-to-day, the Monitor is managed exactly like any other systemd service. It is also exposed as two entries inside the ProxMenux TUI under Settings:
# Manual control
systemctl status proxmenux-monitor.service
systemctl is-active proxmenux-monitor.service
systemctl enable --now proxmenux-monitor.service
systemctl disable --now proxmenux-monitor.service
journalctl -u proxmenux-monitor.service -f
See Settings → ProxMenux Monitor for the in-menu toggle and status verification flow.
Where to next
- Architecture — Flask backend, systemd unit, SQLite schema, AI providers, notification channels.
- Access & Authentication — first launch, password setup, TOTP 2FA, reverse-proxy configuration, Fail2Ban integration.
- Dashboard — every section of the UI, one page each.
- API Reference — every endpoint, request / response shape and token management.
- Integrations — Homepage, Home Assistant, Grafana / Prometheus, Uptime Kuma, generic cURL pattern.