Health Monitor
The continuous self-check that scans ten categories of host state on a five-minute cycle, samples vital signs continuously between cycles, deduplicates findings into a structured event stream, and feeds the dashboard, the notification engine and the optional AI rewriter from one source of truth.
One scanner, three consumers
error_key, and lets (1) the dashboard render the current state, (2) the notification engine fan out new events to the configured channels, and (3) the optional AI assistant rewrite alerts in plain language. You configure the scanner once; everything downstream stays in sync.How it works
The Health Monitor runs on two parallel lanes inside the Monitor process. A lightweight vital signs sampler reads CPU, memory and temperature every few seconds so that sustained-threshold conditions are detected fast; in parallel, the full health cycle runs every five minutes and exercises every category from end to end. Both lanes converge into the same SQLite tables — and from there, three consumers read the state independently.
From sample to stored finding
The scanner. Vital signs are sampled fast so sustained-CPU / sustained-memory pressure can be detected before the next 5-min cycle. The full cycle reads those buffers and runs the heavier checks (SMART, ZFS pool state, journal scanning, service health, etc.) before writing the structured findings to SQLite.
From stored finding to user
The notification path. The same errors table also drives the dashboard view (Active / Dismissed lists rendered live) and is consumed by the cleanup routine at the end of each cycle to auto-resolve stale entries — both run from the same data without going through the dispatcher.
The ten categories
Every cycle exercises ten independent checkers. Each produces one of four statuses (OK, INFO, WARNING, CRITICAL) plus a structured payload — device names, sample log lines, exact thresholds — that surface in the dashboard and travel through to the notification body.
| Category | Sub-checks | Typical events |
|---|---|---|
| CPU & Temperature | CPU usage with hysteresis, sensor temperature | High sustained load; CPU temperature crossing the vendor warning / critical thresholds. |
| Memory & Swap | RAM usage, swap usage | Sustained memory pressure; OOM-killer activity; swap exhaustion. |
| Storage | Proxmox storages, root filesystem | Storage offline (NFS server unreachable, CIFS expired creds); root mount > 90 %; LVM thin pool nearing full. |
| Disks & SMART | SMART, dmesg I/O errors, ZFS pools, LVM, filesystem errors | SMART health failed; reallocated / pending sectors; ATA I/O errors; ZFS pool DEGRADED / FAULTED; ext4 read-only remount. |
| Network | Connectivity, link state, gateway latency | Bridge or bond down; gateway unreachable; persistent latency spikes. |
| VMs & Containers | QMP communication, VM startup, container startup | Failed VM boot; CT shutdown failure; QMP socket timeout; missing config / disk after a clone. |
| PVE Services | pveproxy, pvedaemon, pvestatd, pve-cluster, cluster mode | Service crashed; cluster quorum lost; pmxcfs stuck. |
| System Logs | Persistent errors, error spikes, error cascades, critical kernel messages | Repeated identical errors; sudden burst of warnings (cascade pattern); BUG: / OOPS: / oom-killer in dmesg. |
| System Updates | Pending updates, security updates, kernel / PVE version, system age | Security updates available; pinned kernel several minor versions behind; host uptime > 90 days. |
| Security & Certificates | Login attempts, certificates expiring, optional Fail2Ban jail status | Repeated SSH / web auth failures; PVE certificate < 30 days from expiring; Fail2Ban active bans. |
Severity model
| Status | Colour | Meaning | Notification |
|---|---|---|---|
| OK | Green | Healthy. No findings in this category. | Silent. |
| INFO | Blue | Transient or already-resolved condition worth noting once. Also used for categories that have only dismissed items left. | Optional. Each event type can be opted in or out per channel. |
| WARNING | Yellow | Attention is needed but the host is still functional. Cause is non-trivial — read the details. | Sent when the per-event toggle is on for the channel. |
| CRITICAL | Red | Functionality broken or data loss possible. Action required. | Sent when the per-event toggle is on for the channel. CPU temperature CRITICAL is treated as a safety alert that re-fires even if previously dismissed. |
A category that is OK but has dismissed events still inside their suppression window is rendered as INFO — to remind you that something is being silenced rather than that nothing was ever wrong.
UNKNOWN, when a check can't complete
UNKNOWN. The dashboard surfaces this as a yellow status — the overall view caps UNKNOWN at WARNING so it never escalates a healthy host to CRITICAL on its own.The dashboard view
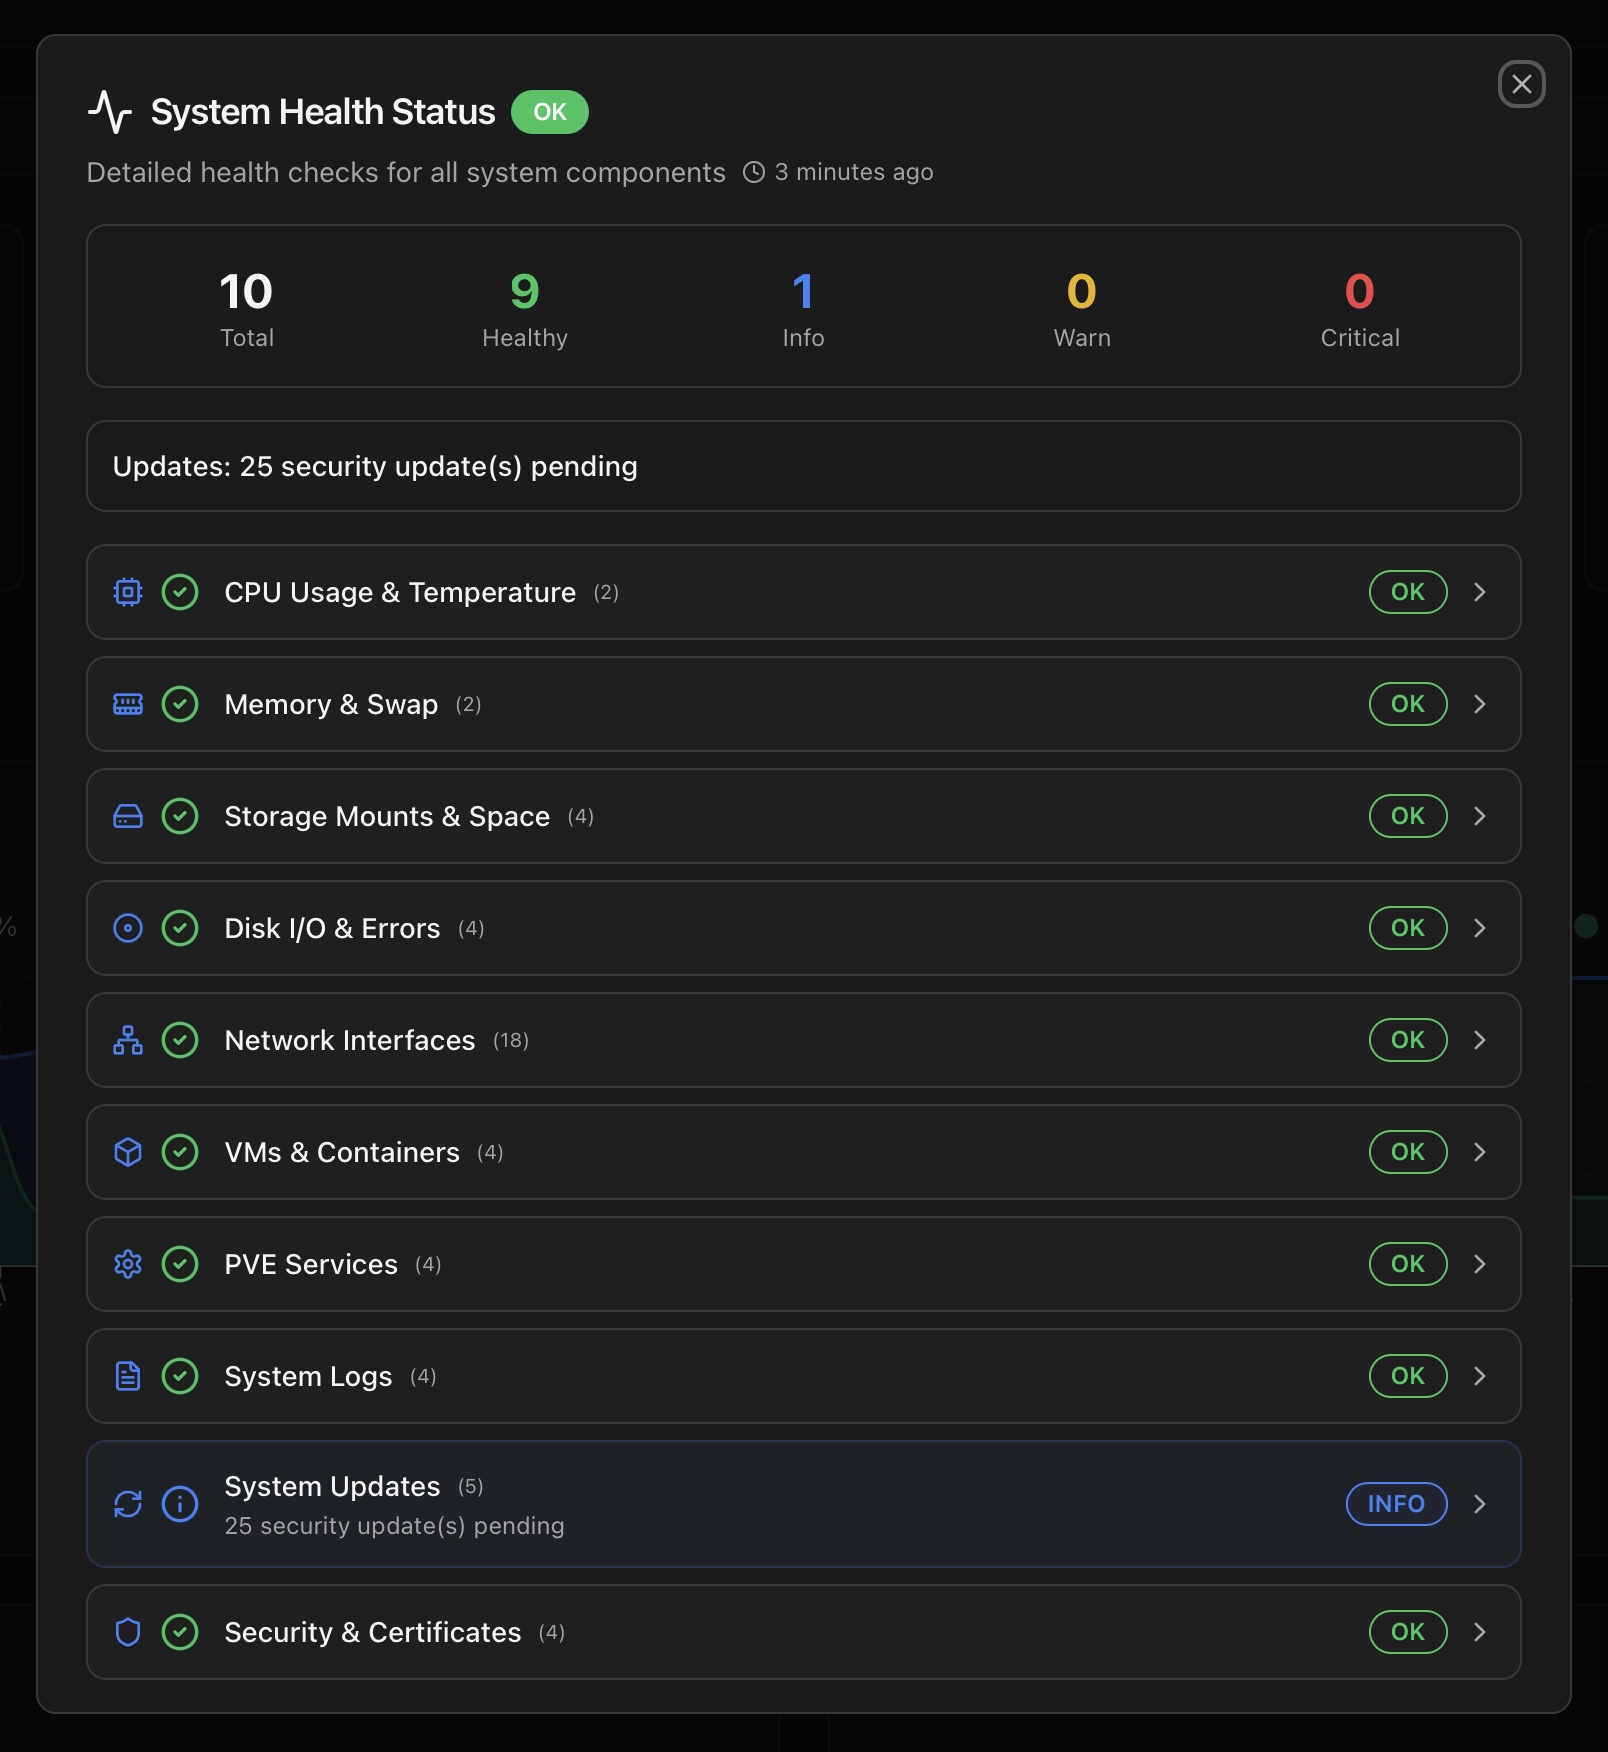
The Health Monitor lives inside the Overview tab. The header status pill (Healthy / Warning / Critical) opens a modal that splits findings into two lists:
- Active — every category with an unresolved finding. Each row expands to show the individual checks that produced the status, the raw
reasonstring, the device or VM ID involved, and (for categories that link to a tab) a click-through into Storage / Network / VMs / Logs / Hardware to investigate. - Dismissed — items previously acknowledged by the user that are still inside their suppression window. Each row shows how much of the suppression remains and the configured duration. When the window expires, the item disappears from this list; if the underlying condition is still present and the category supports re-firing, it re-appears in Active.
The pill mirrors the worst category
Dismissing alerts and the Suppression Duration
Some events are noisy by nature — a System Updates: pending updates available stays true until you patch the host, and you don't want a notification every five minutes for a week. The Health Monitor solves this with two coupled mechanisms:
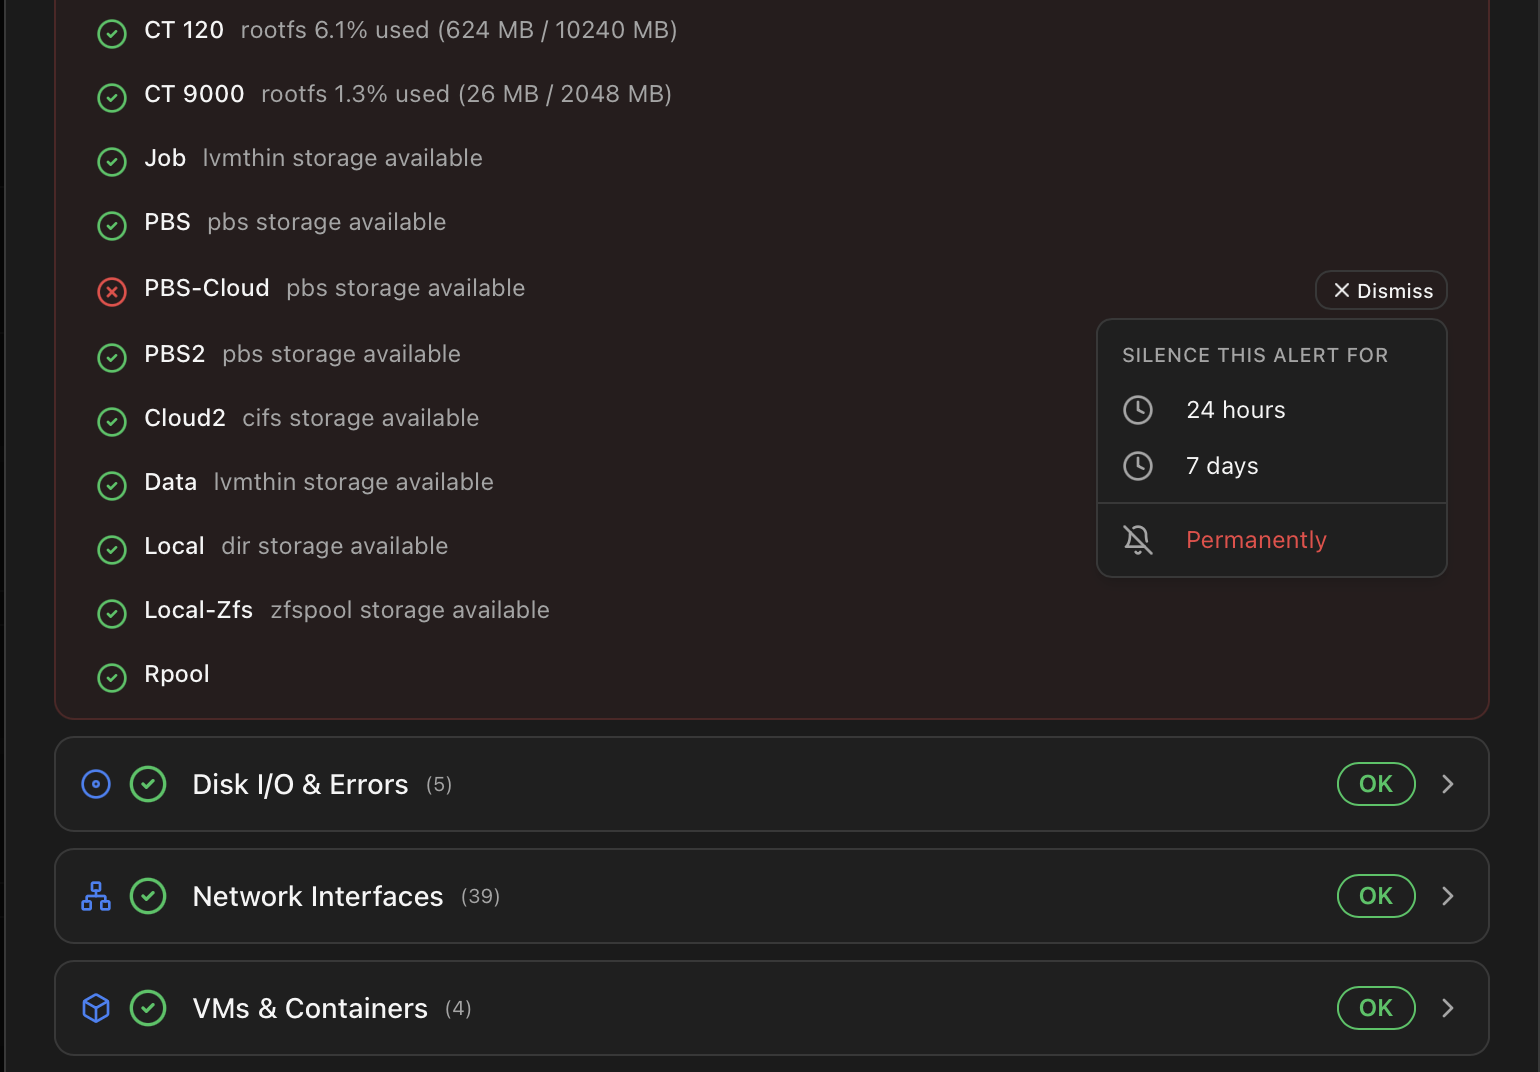
- Per-event Dismiss action in the modal. The Dismiss button opens a small dropdown with three options — 24 hours, 7 days or Permanently — letting you choose how long this specific alert stays silenced regardless of the category's default. Picking one calls
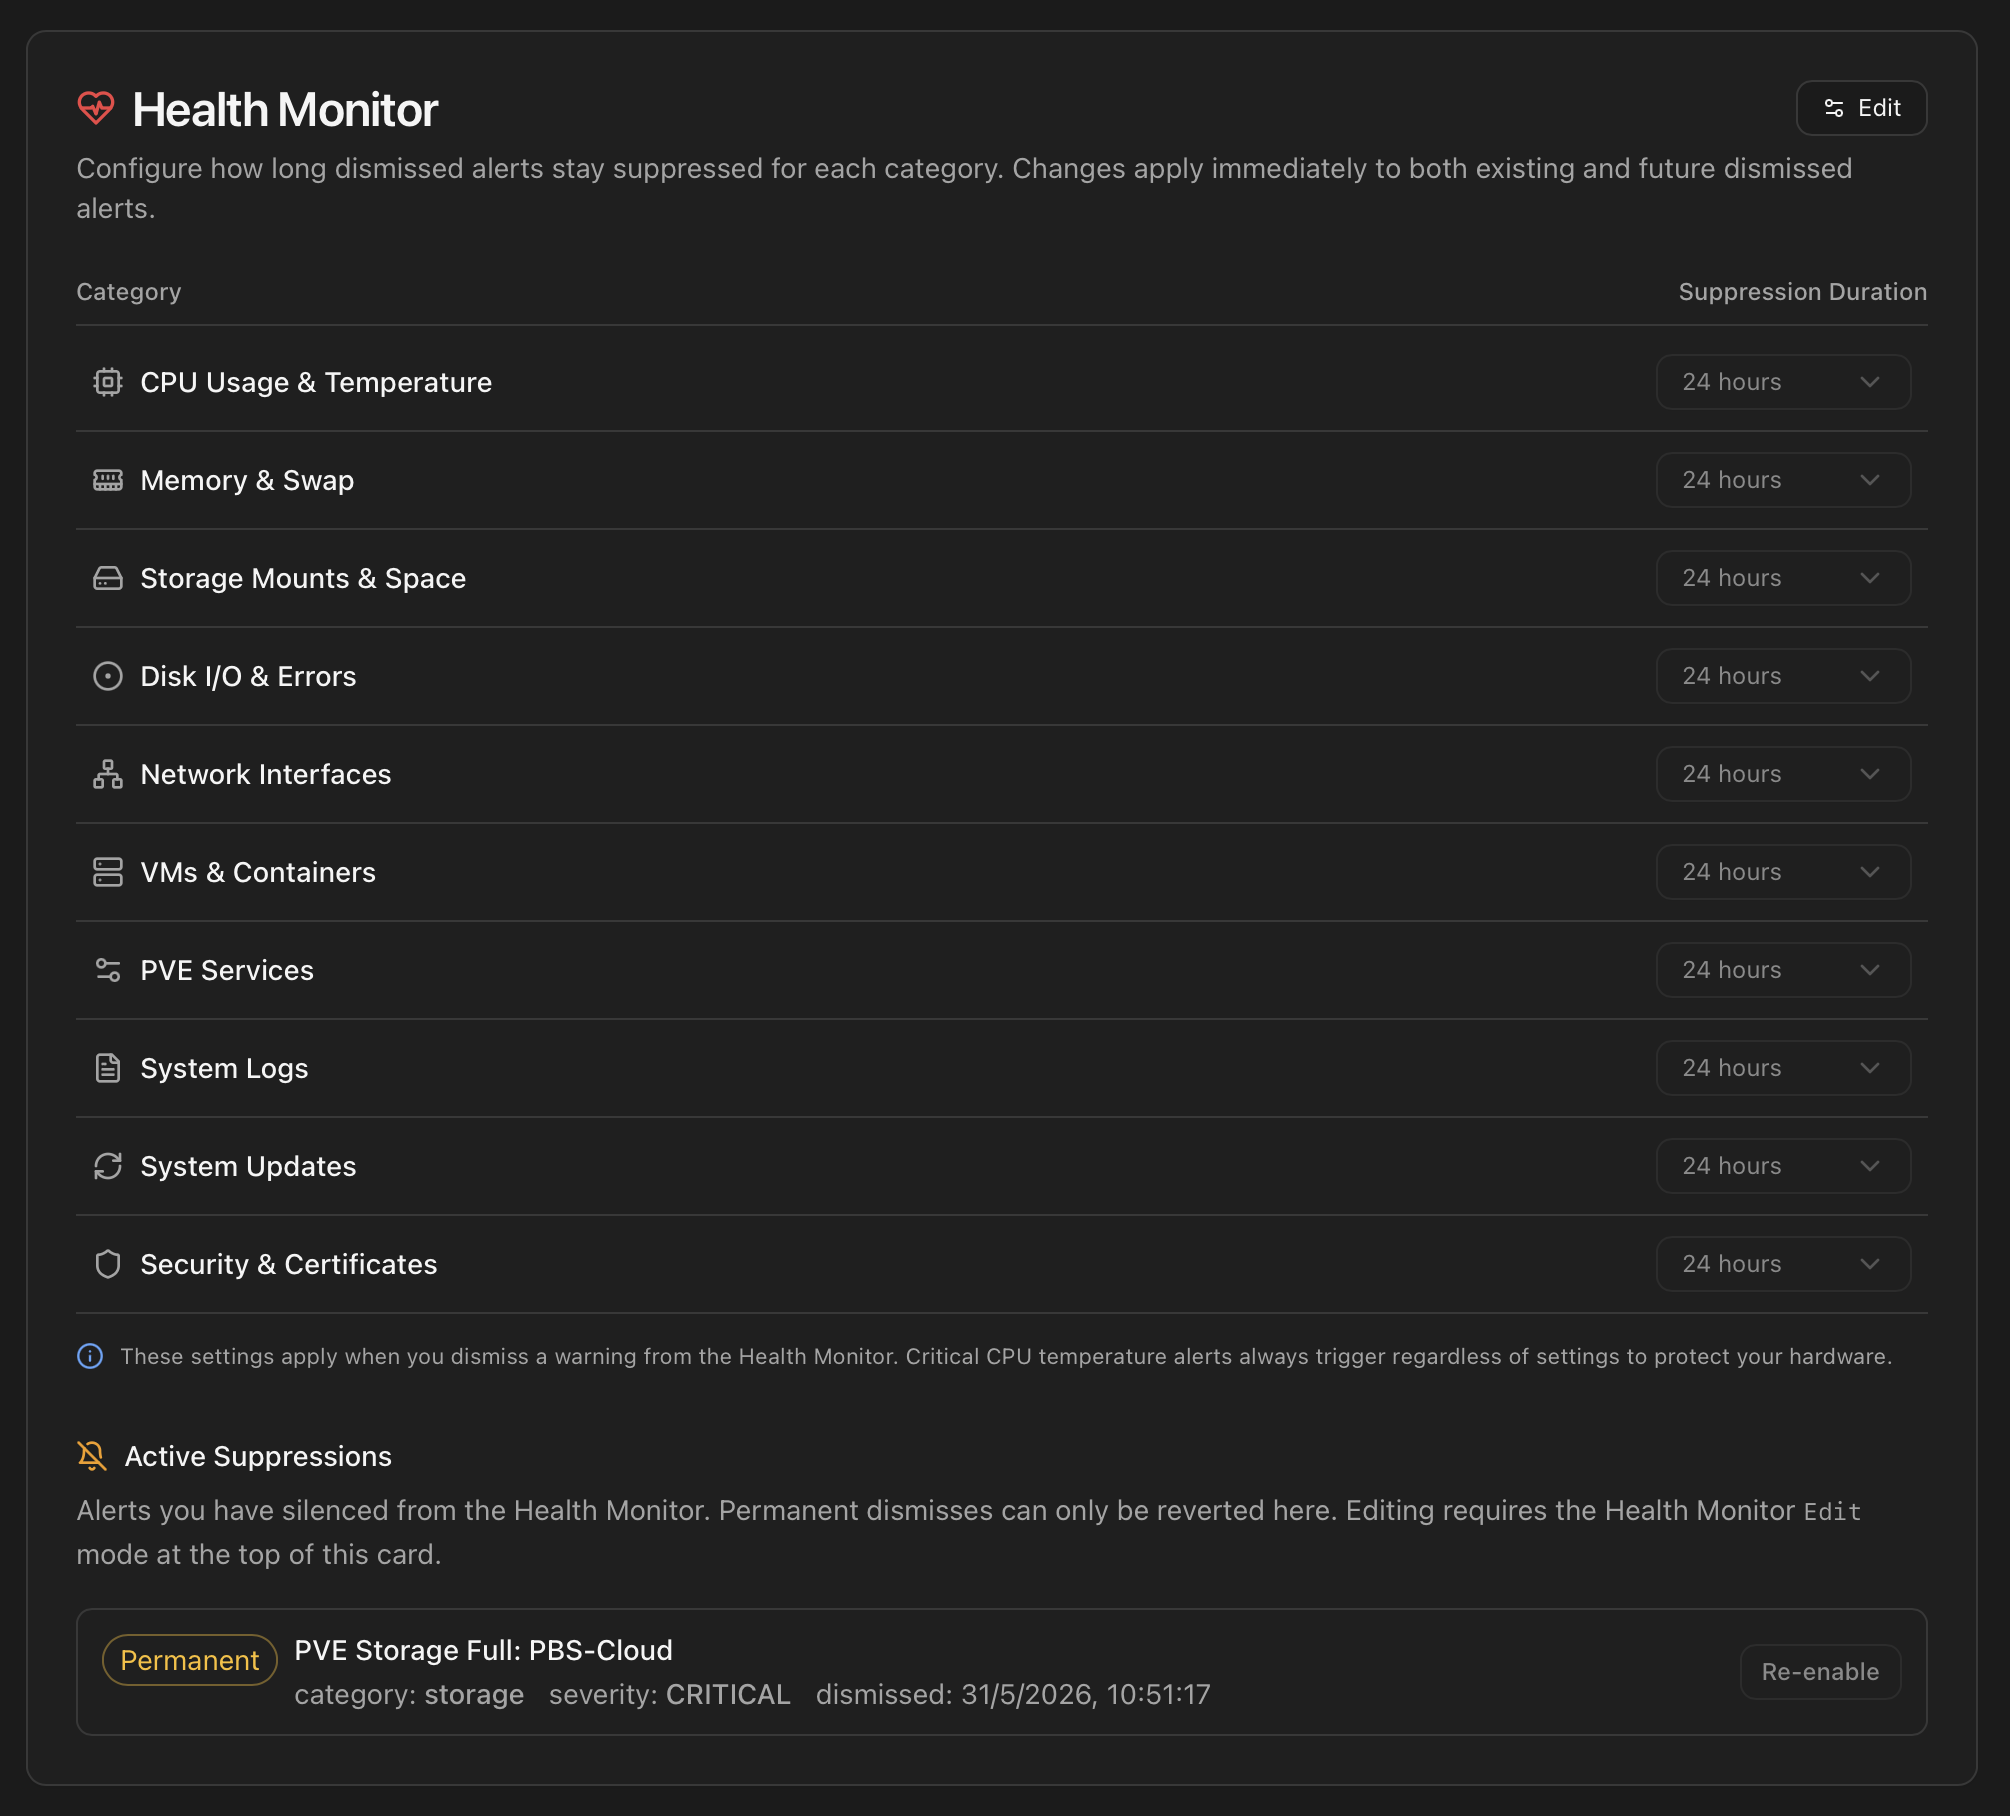
POST /api/health/acknowledgewith theerror_keyand the chosensuppression_hours(-1for permanent). The event moves to the Dismissed list with a timestampedacknowledged_at. - Per-category Suppression Duration setting. From the Settings → Health Monitor card (or
POST /api/health/settings), each of the ten categories has its own default window applied when a Dismiss is fired without a per-event choice:24 hours (default) 72 hours 168 hours (one week) 720 hours (one month) 8760 hours (one year) -1 (permanent — never re-fires) <custom> (any positive integer of hours)
While an event is suppressed, the scanner still runs and updates the row's last_seen timestamp, but no new notification is dispatched and the dashboard stays calm. When the window expires, the next cycle re-evaluates the condition and either re-fires fresh or, if the condition has cleared on its own, drops the row from the lists.
Reviewing and reverting dismisses — the Active Suppressions panel
Every currently-silenced alert (time-limited and permanent) is listed under Settings → Health Monitor → Active Suppressions. Each row shows the alert identifier, category, severity, when it was dismissed and how much time is left, plus a Re-enable button that clears the acknowledgment so the alert can fire again on the next scan. Permanent dismisses can only be reverted from here; time-limited ones can also be force-revived without waiting for the countdown. The Re-enable action is gated by the Health Monitor Edit mode at the top of that card — toggle Edit, click Re-enable on each row you want to revive (queued rows show a green border and a strike-through), then click Save to commit. Cancel discards the queue.
Auto-suppression when you change the Duration
Setting a category's Suppression Duration to anything other than the default 24 h has a second effect beyond user-initiated dismissals: future findings in that category enter the table already acknowledged with that duration. This is by design — if you've told the Monitor that you want disk-related events silenced for a week, brand-new disk findings honour that intent without you having to dismiss each one by hand. They appear directly in the Dismissed list with the configured remaining time. Categories left at 24 h are unaffected and behave the classic way (new findings land in Active until you act).
CPU temperature CRITICAL is the safety override
Findings that cannot be dismissed
A handful of findings are flagged non-dismissable on purpose — they signal a condition where silencing the alert could cost data, hardware or connectivity. The Dismiss button is hidden for these rows; the alert clears only when the underlying condition recovers and the auto-resolve cleanup picks it up. Other findings (transient I/O events on a healthy disk, recovered states) are also marked non-dismissable but for the opposite reason: there's nothing to silence because the row is already informational and self-clearing.
| Finding | Why it can't be dismissed |
|---|---|
| CPU temperature warning / critical | Hardware risk — sustained over-temperature damages silicon. Silencing would let a cooking CPU run unnoticed. |
| Filesystem space critical (root mount) | Data loss risk — a full root prevents writes and corrupts state. The alert must remain visible until you free space. |
| ZFS pool DEGRADED / FAULTED | Data integrity risk — pool failure threatens every dataset on it. Silencing while the pool is unhealthy is never the right answer. |
| Disk I/O errors with SMART FAILED | Drive failure confirmed by SMART — masking hides real hardware dying. The alert stays until the device is replaced (or removed from the host). |
| Network interface DOWN | Connectivity loss — bridges, bonds and physical interfaces with active traffic must stay visible. Silencing them would mask a remote-management outage. |
| I/O events on healthy disks (INFO) | Transient ATA / dmesg events on a disk whose SMART says OK — flagged INFO and self-clearing. Nothing to dismiss because the next cycle already removes them. |
Everything else can be dismissed. The principle is: alerts that indicate "real damage in progress" or that have already self-resolved are kept off the dismiss path; alerts about sustained conditions you may want to acknowledge and re-check later (high CPU usage, pending updates, certificate near expiry, log warnings, VM startup hiccups, etc.) all expose the Dismiss button.
Auto-resolution and cleanup
Many alerts should clear themselves when the condition goes away — a VM that was failing to start and is now running, a disk that's no longer in the system, a temperature that dropped back to normal. A cleanup routine runs at the end of each five-minute cycle and applies these rules:
| Trigger | Action |
|---|---|
| CPU usage back to normal range after a CPU-related warning. | Marked resolved. Drops out of the Active list. |
| Memory pressure back below the warning threshold after an OOM / memory warning. | Marked resolved. |
VM / CT referenced by the error no longer exists (qm status / pct status non-zero). | Marked resolved as resource removed. |
Disk referenced by the error no longer present in /dev/. | Marked resolved as device removed. The permanent observation history is preserved (see next section). |
Findings sourced from the journal (logs category, SMART entries, ATA / I/O errors) when their suppression window expires. | Removed cleanly. Each scan inspects fresh journal entries from that point forward; the same historic line in the journal is not re-emitted. |
| Resolved errors older than seven days. | Deleted from the database to keep the table small. Notification history is independent and kept longer. |
Permanent suppression is not the same as resolved
-1 (permanent) silences future alerts for items you dismiss in that category — but it does not skip the auto-resolve check above. If the underlying condition disappears (resource deleted, threshold no longer breached), the item is still cleaned up automatically.Disk observations — the permanent history
Disk events are special. A SMART warning on /dev/sdh at 02:14 AM is something you want to remember even after the I/O storm subsided and the error auto-resolved — the disk has a track record now. For that purpose, the Health Monitor keeps a separate permanent table: disk_observations.
| Property | errors table (Active) | disk_observations table |
|---|---|---|
| Purpose | Drives the current health view + notification dispatch. | Permanent per-disk audit trail. |
| Auto-resolve | Yes — rows are cleared when the condition disappears. | No — entries persist forever unless the user explicitly dismisses them. |
| Dedup key | error_key (e.g. smart_sdh). | (disk_registry_id, error_type, error_signature) with stable signatures stripped of volatile data. |
| Where shown | Health Monitor modal (Active / Dismissed lists). | Disk detail card in the Storage tab, with an "X obs." badge per disk. |
| What it records | Whatever is currently failing. | SMART warnings (sector issues / temperature / CRC / failed self-tests), I/O errors (ATA / NVMe / dm), filesystem errors, ZFS pool events. |
Practical consequence: an alert can clear from the dashboard while the same incident is still recorded in the disk's history. When you click into a disk under Storage, the card shows the count of outstanding observations and a list with timestamps, severity and the original raw message — useful when you're deciding whether a drive needs replacement.
Cross-device renames are merged automatically
ata8, nvme0n1p3) before getting a stable block-device name. The observation layer consolidates entries by serial number when known: if an event was first recorded as ata8 and the same disk is later identified as sdh, the historic observations are reattached to sdh on the next cycle so the history isn't fragmented.From a finding to a notification
Every active error is also a candidate for the notification engine. The flow:
- The scanner records the finding with category + severity + structured details.
- If the event type is enabled in the global notification settings, and the channel hasn't silenced this category, an event is queued.
- The template engine renders a (title, body) pair from the structured details. If the AI rewriter is enabled, the same pair is also passed through the configured provider for a plain-language version.
- The channel implementation ships it: Telegram message, Discord embed, Gotify push or email. The dispatch outcome is stored in
notification_history. - If a dismiss arrives later, the suppression window kicks in and any further re-fires of the same
error_keystay queue-side until the window closes.
Channel configuration (Telegram bot token, webhook URLs, AI provider keys, per-event toggles, channel overrides) is documented in Notifications and AI Assistant.
REST endpoints
Everything the modal does is callable from the API — handy for scripts, custom dashboards or your own chat-bot integration.
| Endpoint | Method | Use |
|---|---|---|
| /api/health | GET | Small health probe — returns JSON with status, timestamp and version. Suitable for Uptime Kuma keyword checks; the receiver must send the bearer header. |
| /api/health/status | GET | Overall health verdict — single severity + summary string. Authenticated. |
| /api/health/details | GET | All ten categories with their per-category statuses and the structured payload that produced each one. |
| /api/health/full | GET | Full snapshot — categories + active errors + dismissed list + custom suppression settings. Backs the modal in one round-trip and uses a 6-min background cache for instant response. |
| /api/health/active-errors | GET | Just the Active list. Filterable by ?category=<name>. |
| /api/health/dismissed | GET | Just the Dismissed list, with remaining suppression hours. |
| /api/health/acknowledge | POST | Body: {"error_key":"smart_sdh"}. Dismiss an alert with the category's configured window. |
| /api/health/settings | GET / POST | Read or write the per-category Suppression Duration values. |
| /api/health/cleanup-orphans | POST | Manual cleanup of errors whose underlying device / VM is gone. Idempotent. |
# Snapshot the current health for a script
curl -H "Authorization: Bearer <api-token>" \
  http://<host>:8008/api/health/full | jq '.health.overall'

# Dismiss a specific error
curl -X POST http://<host>:8008/api/health/acknowledge \
  -H "Authorization: Bearer <api-token>" \
  -H "Content-Type: application/json" \
  -d '{"error_key":"smart_sdh"}'

# Set the disks-category suppression to a week
curl -X POST http://<host>:8008/api/health/settings \
  -H "Authorization: Bearer <api-token>" \
  -H "Content-Type: application/json" \
  -d '{"suppress_disks":"168"}'
Where to next
- Dashboard — where the Health Monitor modal is opened from in the UI.
- Notifications — channels, per-event toggles, the AI rewrite hook, history.
- AI Assistant — provider configuration (OpenAI / Anthropic / Gemini / Groq / Ollama / OpenRouter), prompt mode, per-channel detail level, language.
- Architecture — the SQLite schema (
errors,disk_observations,events) and the background-thread cadence.