Integrations
Copy-paste recipes for plugging ProxMenux Monitor into the dashboards and tools your homelab already uses — Homepage, Home Assistant, Grafana via Prometheus, Uptime Kuma. Each recipe shows the exact config the receiving tool expects, the Monitor endpoint it talks to, and the auth header pattern that holds it together.
What you can build from this page
Authentication: the one thing every recipe needs
Most endpoints used by these integrations are authenticated. You have two ways to satisfy that requirement.
Option A — API token (recommended for integrations)
Open the dashboard and go to Settings → Security → API Tokens. Click Generate token, give it a name (e.g. homepage, home-assistant, prometheus), and copy the token — it's shown once. Long-lived (one-year expiry by default), individually revocable, and what you should be using for any non-browser client.
From that point every request is just:
curl -H "Authorization: Bearer <api-token>" http://<host>:8008/api/system | jqOption B — login flow (username + password)
Useful for scripts that authenticate as a human user. The returned token is short-lived; most integrations should prefer Option A.
# 1. Exchange credentials for a JWT
curl -X POST http://<host>:8008/api/auth/login \
  -H "Content-Type: application/json" \
  -d '{"username":"admin","password":"<your-password>","totp_token":"123456"}' | jq -r '.token'

# 2. Use the returned token exactly like an API token
curl -H "Authorization: Bearer <returned-token>" http://<host>:8008/api/system | jq
The TOTP field is only required when 2FA is enabled on the account. Token rotation, revocation, password policy and the audit log live in Access & Authentication.
Using HTTPS instead of HTTP
http:// in the URLs to keep the examples short. If you've enabled TLS on the Monitor (Settings → Security → SSL/HTTPS), swap http:// for https:// in every URL — that's the only change. Two notes specific to certain tools:- Self-signed certificates. Home Assistant's
rest:integration verifies TLS by default. If the Monitor is using its own self-signed cert, addverify_ssl: falseto each REST block (alongsidescan_interval:), or import the Monitor's CA into HA's trust store. Same for any tool that refuses untrusted certs. - Prometheus already has
scheme: httpsready in the scrape config below; uncomment / leave it ashttpsif TLS is enabled on the Monitor.
Homepage
Homepage is a fully static, customizable application dashboard. ProxMenux Monitor plugs into it via the built-in customapi widget — paste a service entry into services.yaml, restart Homepage, and the card appears with live numbers.
The official ProxMenux logo is on dashboardicons.com
icon: proxmenux.png. Homepage automatically resolves bare filenames against dashboardicons.com — a curated icon library for self-hosted dashboards. The ProxMenux entry lives at dashboardicons.com/icons/external/proxmenux and Homepage pulls it on first render. Same lookup works for thousands of other tools (Telegram, Discord, Grafana, Tailscale, etc.) — just write icon: <name>.png in any service entry.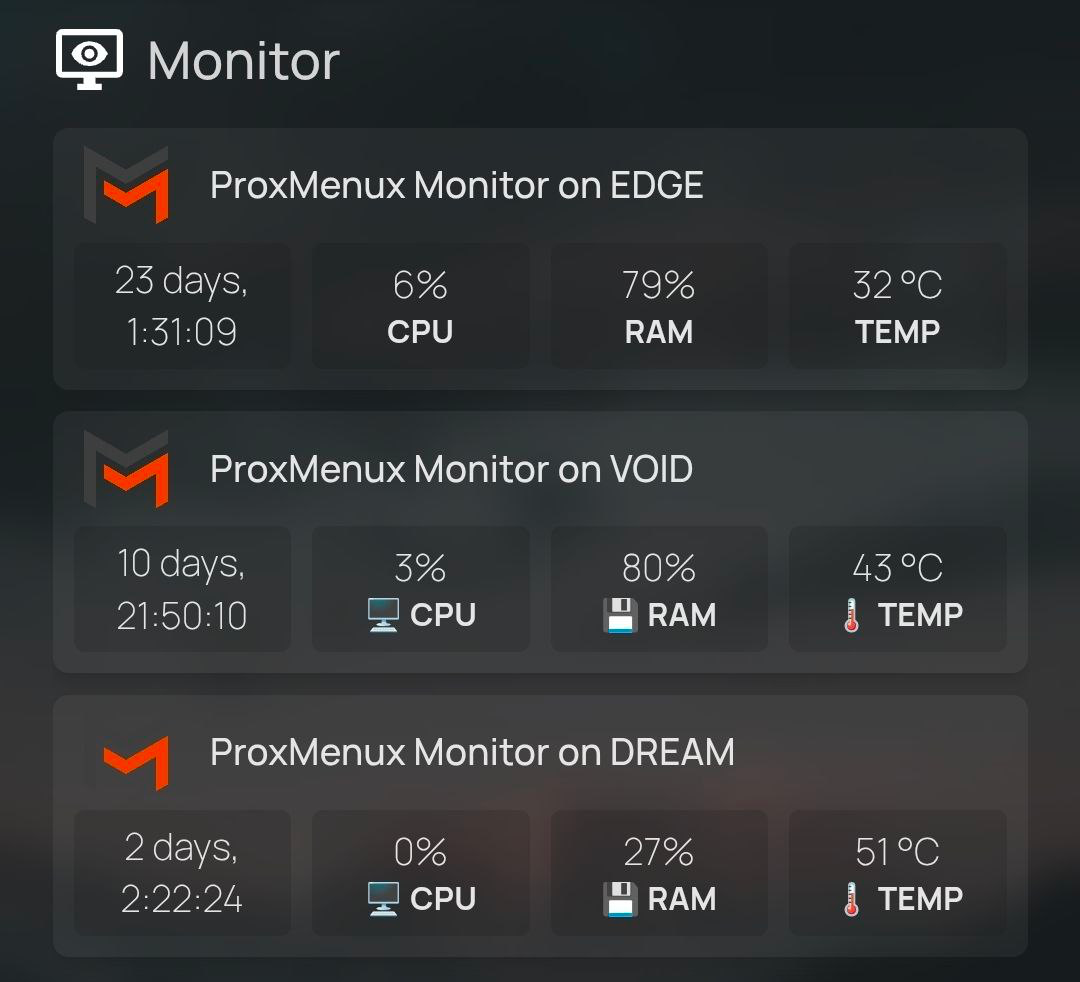
/api/system on each host every 10 s.Basic widget — no authentication
Use this when ProxMenux Monitor is on a trusted network and you haven't enabled authentication on the Monitor side yet. The simplest possible services.yaml entry:
- ProxMenux Monitor:
    href: http://proxmox.example.tld:8008/
    icon: proxmenux.png
    widget:
      type: customapi
      url: http://proxmox.example.tld:8008/api/system
      refreshInterval: 10000
      mappings:
        - field: uptime
          label: Uptime
          icon: lucide:clock-4
          format: text
        - field: cpu_usage
          label: CPU
          icon: lucide:cpu
          format: percent
        - field: memory_usage
          label: RAM
          icon: lucide:memory-stick
          format: percent
        - field: temperature
          label: Temp
          icon: lucide:thermometer-sun
          format: number
          suffix: °C
Authenticated widget
Generate an API token in Settings → Security → API Tokens on the Monitor, copy it, and paste it into the Authorization header below — replace the example token shown after Bearer with the one you just copied:
- ProxMenux Monitor:
    href: http://proxmox.example.tld:8008/
    icon: proxmenux.png
    widget:
      type: customapi
      url: http://proxmox.example.tld:8008/api/system
      headers:
        Authorization: Bearer eyJhbGciOiJIUzI1NiJ9.abc123def456ghi789
      refreshInterval: 10000
      mappings:
        - field: uptime
          label: Uptime
          icon: lucide:clock-4
          format: text
        - field: cpu_usage
          label: CPU
          icon: lucide:cpu
          format: percent
        - field: memory_usage
          label: RAM
          icon: lucide:memory-stick
          format: percent
        - field: temperature
          label: Temp
          icon: lucide:thermometer-sun
          format: number
          suffix: °C
Restart Homepage and the card lights up with live values. Reuse the same token across all Homepage widgets pointing at the same ProxMenux Monitor host.
Multi-widget setup — system, storage, network
For a richer view, render three separate cards backed by different endpoints — one for system metrics, one for storage, one for network. Use the same token in every card; it's the same Monitor instance.
- ProxMenux System:
    href: http://proxmox.example.tld:8008/
    icon: lucide:server
    description: Proxmox VE Host
    widget:
      type: customapi
      url: http://proxmox.example.tld:8008/api/system
      headers:
        Authorization: Bearer eyJhbGciOiJIUzI1NiJ9.abc123def456ghi789
      refreshInterval: 5000
      mappings:
        - field: cpu_usage
          label: CPU
          icon: lucide:cpu
          format: percent
        - field: memory_usage
          label: RAM
          icon: lucide:memory-stick
          format: percent
        - field: temperature
          label: Temp
          icon: lucide:thermometer-sun
          format: number
          suffix: °C

- ProxMenux Storage:
    href: http://proxmox.example.tld:8008/#/storage
    icon: lucide:hard-drive
    description: Storage Overview
    widget:
      type: customapi
      url: http://proxmox.example.tld:8008/api/storage/summary
      headers:
        Authorization: Bearer eyJhbGciOiJIUzI1NiJ9.abc123def456ghi789
      refreshInterval: 30000
      mappings:
        - field: total
          label: Total
          icon: lucide:database
          format: number
          suffix: " TB"
        - field: used
          label: Used
          icon: lucide:folder
          format: number
          suffix: " GB"
        - field: disk_count
          label: Disks
          icon: lucide:hard-drive
          format: number

- ProxMenux Network:
    href: http://proxmox.example.tld:8008/#/network
    icon: lucide:network
    description: Network Stats
    widget:
      type: customapi
      url: http://proxmox.example.tld:8008/api/network/summary
      headers:
        Authorization: Bearer eyJhbGciOiJIUzI1NiJ9.abc123def456ghi789
      refreshInterval: 5000
      mappings:
        - field: traffic.bytes_recv
          label: Received
          icon: lucide:download
          format: bytes
        - field: traffic.bytes_sent
          label: Sent
          icon: lucide:upload
          format: bytes
        - field: physical_active_count
          label: NICs up
          icon: lucide:network
          format: number
Multiple Proxmox hosts
http://<host>:8008 URL of its own ProxMenux Monitor instance. The token can be different per host (one secret entry per host) or shared, depending on how you generate them.Home Assistant
There is no native HACS integration for ProxMenux Monitor (yet) — but you don't need one. The built-in rest integration in Home Assistant can pull every endpoint documented in the API Reference and turn the responses into sensors, attributes and triggers. The complete reference build below exposes ~25 sensors covering system resources, the Health Monitor, VMs / CTs, storage, network, gateway latency and ProxMenux update status — drop the YAML into configuration.yaml, restart, and you have a full Proxmox observability layer inside HA.
1 · Store the API token
Drop the token into Home Assistant's secrets.yaml so it never leaks into a config dump. The whole bearer prefix goes in one line — that lets the YAML reference it directly as a header value. Filename and location depend on your HA install (typically /config/secrets.yaml for HA OS / Container).
# secrets.yaml — add this file to .gitignore
proxmenux_token_header: "Bearer <your_actual_api_token_here>"
2 · Drop in the REST configuration
Six REST blocks cover the full surface — one per major Monitor area. Each block has a sensible scan_interval tuned to how often the underlying data changes (system resources every 30 s, health every 60 s, slowly-changing inventories every 5-10 min). Paste into configuration.yaml:
rest:
  # ─── Block 1: system resources (CPU, memory, temperature, uptime, host info) ───
  - resource: http://<proxmenux-host>:8008/api/system
    headers:
      Authorization: !secret proxmenux_token_header
    scan_interval: 30
    sensor:
      - name: "ProxMenux CPU"
        unique_id: proxmenux_cpu
        value_template: "{{ value_json.cpu_usage }}"
        unit_of_measurement: "%"
        state_class: measurement
        icon: mdi:cpu-64-bit
      - name: "ProxMenux RAM"
        unique_id: proxmenux_ram
        value_template: "{{ value_json.memory_usage }}"
        unit_of_measurement: "%"
        state_class: measurement
        icon: mdi:memory
      - name: "ProxMenux Memory Used"
        unique_id: proxmenux_memory_used
        value_template: "{{ value_json.memory_used }}"
        unit_of_measurement: "GB"
        state_class: measurement
        icon: mdi:memory
      - name: "ProxMenux Memory Total"
        unique_id: proxmenux_memory_total
        value_template: "{{ value_json.memory_total }}"
        unit_of_measurement: "GB"
        icon: mdi:memory
      - name: "ProxMenux CPU Temperature"
        unique_id: proxmenux_cpu_temperature
        value_template: "{{ value_json.temperature }}"
        unit_of_measurement: "°C"
        device_class: temperature
        state_class: measurement
      - name: "ProxMenux Uptime"
        unique_id: proxmenux_uptime
        value_template: "{{ value_json.uptime }}"
        icon: mdi:clock-outline
      - name: "ProxMenux Load 1m"
        unique_id: proxmenux_load_1m
        value_template: "{{ value_json.load_average[0] | round(2) }}"
        state_class: measurement
        icon: mdi:gauge
      - name: "ProxMenux Available Updates"
        unique_id: proxmenux_available_updates
        value_template: "{{ value_json.available_updates }}"
        state_class: measurement
        icon: mdi:package-up
      - name: "ProxMenux Host"
        unique_id: proxmenux_host
        value_template: "{{ value_json.hostname }}"
        json_attributes:
          - kernel_version
          - proxmox_version
          - cpu_cores
          - cpu_threads

  # ─── Block 2: Health Monitor (overall + per-category + active errors) ───
  - resource: http://<proxmenux-host>:8008/api/health/full
    headers:
      Authorization: !secret proxmenux_token_header
    scan_interval: 60
    sensor:
      - name: "ProxMenux Health"
        unique_id: proxmenux_health_overall
        value_template: "{{ value_json.health.overall }}"
        json_attributes_path: "$.health"
        json_attributes:
          - summary
          - details
        icon: mdi:heart-pulse
      - name: "ProxMenux Active Errors"
        unique_id: proxmenux_active_errors
        value_template: "{{ value_json.active_errors | length }}"
        state_class: measurement
        icon: mdi:alert-circle
        json_attributes:
          - active_errors
      - name: "ProxMenux Dismissed Errors"
        unique_id: proxmenux_dismissed_errors
        value_template: "{{ value_json.dismissed | length }}"
        state_class: measurement
        icon: mdi:alert-circle-outline

  # ─── Block 3: VMs and containers ───
  - resource: http://<proxmenux-host>:8008/api/vms
    headers:
      Authorization: !secret proxmenux_token_header
    scan_interval: 60
    sensor:
      - name: "ProxMenux VMs Total"
        unique_id: proxmenux_vms_total
        value_template: "{{ value_json | length }}"
        state_class: measurement
        icon: mdi:server
        json_attributes:
          - vms
      - name: "ProxMenux VMs Running"
        unique_id: proxmenux_vms_running
        value_template: >
          {{ value_json | selectattr('status', 'eq', 'running') | list | length }}
        state_class: measurement
        icon: mdi:play-circle
      - name: "ProxMenux VMs Stopped"
        unique_id: proxmenux_vms_stopped
        value_template: >
          {{ value_json | selectattr('status', 'eq', 'stopped') | list | length }}
        state_class: measurement
        icon: mdi:stop-circle

  # ─── Block 4: Storage summary ───
  - resource: http://<proxmenux-host>:8008/api/storage/summary
    headers:
      Authorization: !secret proxmenux_token_header
    scan_interval: 300
    sensor:
      - name: "ProxMenux Storage Total"
        unique_id: proxmenux_storage_total
        value_template: "{{ value_json.total }}"
        unit_of_measurement: "TB"
        icon: mdi:harddisk
      - name: "ProxMenux Storage Used"
        unique_id: proxmenux_storage_used
        value_template: "{{ value_json.used }}"
        unit_of_measurement: "GB"
        state_class: measurement
        icon: mdi:harddisk
      - name: "ProxMenux Storage Available"
        unique_id: proxmenux_storage_available
        value_template: "{{ value_json.available }}"
        unit_of_measurement: "GB"
        state_class: measurement
      - name: "ProxMenux Disk Count"
        unique_id: proxmenux_disk_count
        value_template: "{{ value_json.disk_count }}"

  # ─── Block 5: Network summary ───
  - resource: http://<proxmenux-host>:8008/api/network/summary
    headers:
      Authorization: !secret proxmenux_token_header
    scan_interval: 30
    sensor:
      - name: "ProxMenux Net Rx Bytes"
        unique_id: proxmenux_net_rx_bytes
        value_template: "{{ value_json.traffic.bytes_recv }}"
        unit_of_measurement: "B"
        device_class: data_size
        state_class: total_increasing
      - name: "ProxMenux Net Tx Bytes"
        unique_id: proxmenux_net_tx_bytes
        value_template: "{{ value_json.traffic.bytes_sent }}"
        unit_of_measurement: "B"
        device_class: data_size
        state_class: total_increasing
      - name: "ProxMenux Physical NICs Up"
        unique_id: proxmenux_physical_nics_up
        value_template: >
          {{ value_json.physical_active_count }} / {{ value_json.physical_total_count }}
        icon: mdi:ethernet
      - name: "ProxMenux Bridges Up"
        unique_id: proxmenux_bridges_up
        value_template: >
          {{ value_json.bridge_active_count }} / {{ value_json.bridge_total_count }}
        icon: mdi:bridge

  # ─── Block 6: ProxMenux update availability ───
  - resource: http://<proxmenux-host>:8008/api/proxmenux/update-status
    headers:
      Authorization: !secret proxmenux_token_header
    scan_interval: 3600
    sensor:
      - name: "ProxMenux Monitor Update"
        unique_id: proxmenux_monitor_update
        value_template: >
          {{ 'update available' if (value_json.stable or value_json.beta) else 'up to date' }}
        json_attributes:
          - stable
          - stable_version
          - beta
          - beta_version
        icon: mdi:update
3 · Add binary sensors and template helpers
Two binary sensors and a couple of template sensors round out the integration — they make automations and Lovelace conditional cards much cleaner than chaining Jinja in every place.
# configuration.yaml — add alongside the rest: block above
# All four template entities live under one template: section (HA modern syntax).
# If you already have a template: section elsewhere, merge the lists into it
# rather than declaring template: a second time.

template:
  - binary_sensor:
      - name: "ProxMenux Healthy"
        default_entity_id: binary_sensor.proxmenux_is_healthy
        device_class: problem
        delay_off: 30
        state: "{{ states('sensor.proxmenux_health') == 'OK' }}"
      - name: "ProxMenux Critical"
        default_entity_id: binary_sensor.proxmenux_has_critical
        device_class: safety
        state: "{{ states('sensor.proxmenux_health') == 'CRITICAL' }}"
  - sensor:
      - name: "ProxMenux Memory Free"
        unique_id: proxmenux_memory_free
        unit_of_measurement: "GB"
        state_class: measurement
        state: >
          {{ (states('sensor.proxmenux_memory_total') | float
              - states('sensor.proxmenux_memory_used') | float) | round(1) }}
      - name: "ProxMenux Storage Usage Percent"
        unique_id: proxmenux_storage_usage_percent
        unit_of_measurement: "%"
        state_class: measurement
        state: >
          {% set used = states('sensor.proxmenux_storage_used') | float %}
          {% set free = states('sensor.proxmenux_storage_available') | float %}
          {% set total = used + free %}
          {{ (used / total * 100) | round(1) if total > 0 else 0 }}
4 · Reload & verify
From the HA UI: Developer Tools → YAML → Check Configuration first to validate the syntax, then All YAML configuration reload (or full restart). After it comes back, filter Settings → Devices & Services → Entities by proxmenux — you should see all ~25 entities populating within one scan interval.
Replacing an earlier version of this recipe?
rest: and template: blocks from configuration.yaml, reload, and then under Settings → Devices & Services → Entities filter by proxmenux and remove any entries marked "Restored" or showing as unavailable. Then paste the current YAML and reload again — the new entities register cleanly.5 · Lovelace dashboard
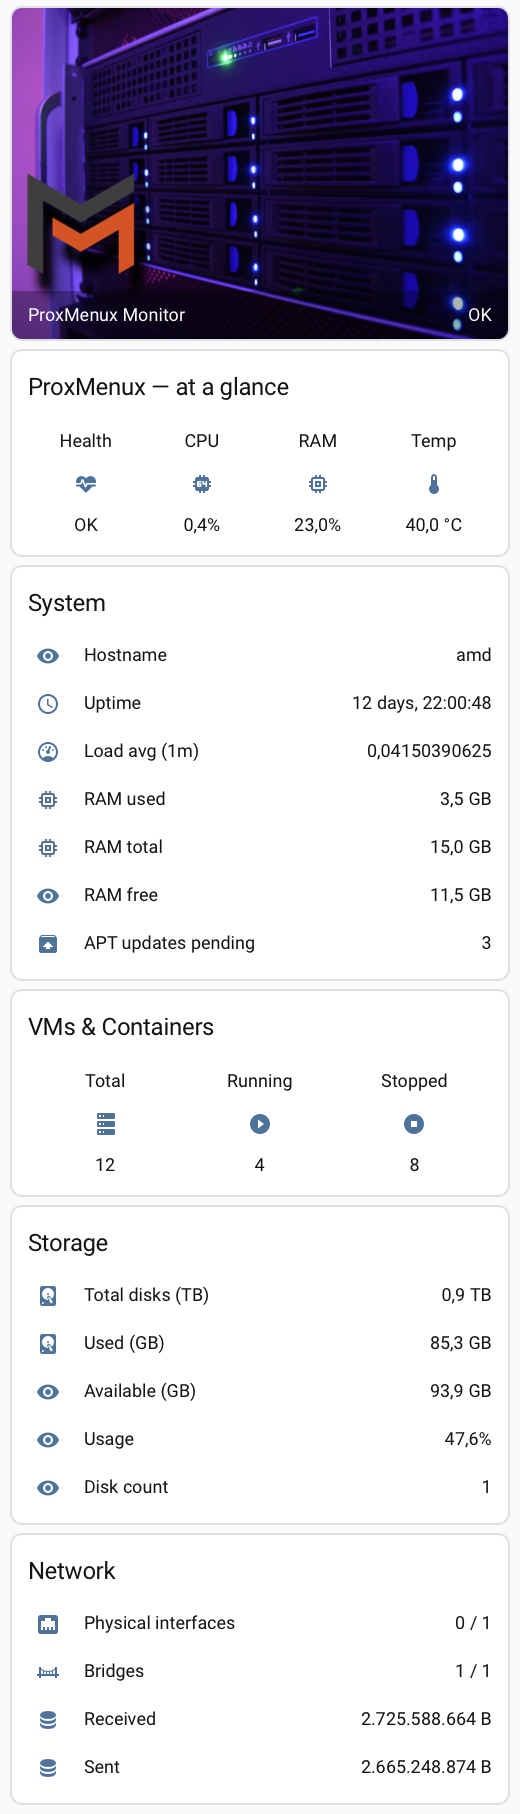
The YAML below is a single vertical-stack card that combines all the sub-cards in one block — header with logo, quick KPIs, system detail, VMs, storage, network and a conditional health-issues card. To use it: open your dashboard, click the pencil (edit), click Add card, scroll to the bottom and pick Manual, then paste:
type: vertical-stack
cards:
  # Header — ProxMenux logo + live health status overlay
  - type: picture-entity
    entity: sensor.proxmenux_health
    name: ProxMenux Monitor
    image: https://cdn.jsdelivr.net/gh/homarr-labs/dashboard-icons/svg/proxmenux.svg
    show_state: true

  # Quick KPIs
  - type: glance
    title: ProxMenux — at a glance
    columns: 4
    entities:
      - entity: sensor.proxmenux_health
        name: Health
      - entity: sensor.proxmenux_cpu
        name: CPU
      - entity: sensor.proxmenux_ram
        name: RAM
      - entity: sensor.proxmenux_cpu_temperature
        name: Temp

  # System detail
  - type: entities
    title: System
    entities:
      - entity: sensor.proxmenux_host
        name: Hostname
      - entity: sensor.proxmenux_uptime
        name: Uptime
      - entity: sensor.proxmenux_load_1m
        name: Load avg (1m)
      - entity: sensor.proxmenux_memory_used
        name: RAM used
      - entity: sensor.proxmenux_memory_total
        name: RAM total
      - entity: sensor.proxmenux_memory_free
        name: RAM free
      - entity: sensor.proxmenux_available_updates
        name: APT updates pending

  # VMs / CTs
  - type: glance
    title: "VMs & Containers"
    columns: 3
    entities:
      - entity: sensor.proxmenux_vms_total
        name: Total
      - entity: sensor.proxmenux_vms_running
        name: Running
      - entity: sensor.proxmenux_vms_stopped
        name: Stopped

  # Storage
  - type: entities
    title: Storage
    entities:
      - entity: sensor.proxmenux_storage_total
        name: Total disks (TB)
      - entity: sensor.proxmenux_storage_used
        name: Used (GB)
      - entity: sensor.proxmenux_storage_available
        name: Available (GB)
      - entity: sensor.proxmenux_storage_usage_percent
        name: Usage
      - entity: sensor.proxmenux_disk_count
        name: Disk count

  # Network
  - type: entities
    title: Network
    entities:
      - entity: sensor.proxmenux_physical_nics_up
        name: Physical interfaces
      - entity: sensor.proxmenux_bridges_up
        name: Bridges
      - entity: sensor.proxmenux_net_rx_bytes
        name: Received
      - entity: sensor.proxmenux_net_tx_bytes
        name: Sent

  # Health detail — only render when there are active errors
  - type: conditional
    conditions:
      - entity: sensor.proxmenux_active_errors
        state_not: "0"
    card:
      type: entities
      title: Active health issues
      entities:
        - entity: sensor.proxmenux_active_errors
          name: Active error count
        - entity: sensor.proxmenux_dismissed_errors
          name: Dismissed (in suppression window)
        - entity: binary_sensor.proxmenux_has_critical
          name: Critical present?
Want it as a full dashboard view instead of a single card?
cards: list from the YAML above):- title: ProxMenux Monitor
icon: mdi:server
cards:
# ... paste the cards from the vertical-stack above, without the
# outer "type: vertical-stack" wrapper, indented one extra level
That gives you a dedicated tab/view in your dashboard with its own icon and title, instead of one long card on an existing view.Alternative — a dedicated dashboard view
If you'd rather have a full dedicated page (its own tab in the dashboard sidebar) than a single card inside an existing view, Home Assistant lets you create a new view directly with YAML. Steps:
- Open the dashboard where you want the new tab.
- Click the pencil (edit dashboard) at the top right.
- Click the + tab at the end of the existing tabs to create a new view.
- In the dialog that opens, switch to the Code editor tab (top right of the dialog — toggles between visual editor and YAML).
- Paste the YAML below.
- Save. The new ProxMenux Monitor tab appears in the sidebar with all cards rendered.
Two YAML editors in HA — pick the right one
- Single-view editor (this recipe) — opened from the + tab or from Edit view → Code editor. Expects the body of one view directly:
title:,path:,cards:at the top level, no leading dash. - Whole-dashboard Raw editor — opened from the dashboard's 3-dot menu. Expects the entire
views:list, with each view as a list item (leading-).
cards: []. The YAML below is for the single-view editor — paste exactly as shown.title: ProxMenux Monitor
path: proxmenux
icon: mdi:server
cards:
# Header — full width
- type: picture-entity
entity: sensor.proxmenux_health
name: ProxMenux Monitor
image: https://cdn.jsdelivr.net/gh/homarr-labs/dashboard-icons/svg/proxmenux.svg
show_state: true
# Quick KPIs — full width
- type: glance
title: ProxMenux — at a glance
columns: 4
entities:
- entity: sensor.proxmenux_health
name: Health
- entity: sensor.proxmenux_cpu
name: CPU
- entity: sensor.proxmenux_ram
name: RAM
- entity: sensor.proxmenux_cpu_temperature
name: Temp
# System detail
- type: entities
title: System
entities:
- entity: sensor.proxmenux_host
name: Hostname
- entity: sensor.proxmenux_uptime
name: Uptime
- entity: sensor.proxmenux_load_1m
name: Load avg (1m)
- entity: sensor.proxmenux_memory_used
name: RAM used
- entity: sensor.proxmenux_memory_total
name: RAM total
- entity: sensor.proxmenux_memory_free
name: RAM free
- entity: sensor.proxmenux_available_updates
name: APT updates pending
# VMs / CTs
- type: glance
title: "VMs & Containers"
columns: 3
entities:
- entity: sensor.proxmenux_vms_total
name: Total
- entity: sensor.proxmenux_vms_running
name: Running
- entity: sensor.proxmenux_vms_stopped
name: Stopped
# Storage
- type: entities
title: Storage
entities:
- entity: sensor.proxmenux_storage_total
name: Total disks (TB)
- entity: sensor.proxmenux_storage_used
name: Used (GB)
- entity: sensor.proxmenux_storage_available
name: Available (GB)
- entity: sensor.proxmenux_storage_usage_percent
name: Usage
- entity: sensor.proxmenux_disk_count
name: Disk count
# Network
- type: entities
title: Network
entities:
- entity: sensor.proxmenux_physical_nics_up
name: Physical interfaces
- entity: sensor.proxmenux_bridges_up
name: Bridges
- entity: sensor.proxmenux_net_rx_bytes
name: Received
- entity: sensor.proxmenux_net_tx_bytes
name: Sent
# Health detail — only render when there are active errors
- type: conditional
conditions:
- entity: sensor.proxmenux_active_errors
state_not: "0"
card:
type: entities
title: Active health issues
entities:
- entity: sensor.proxmenux_active_errors
name: Active error count
- entity: sensor.proxmenux_dismissed_errors
name: Dismissed (in suppression window)
- entity: binary_sensor.proxmenux_has_critical
name: Critical present?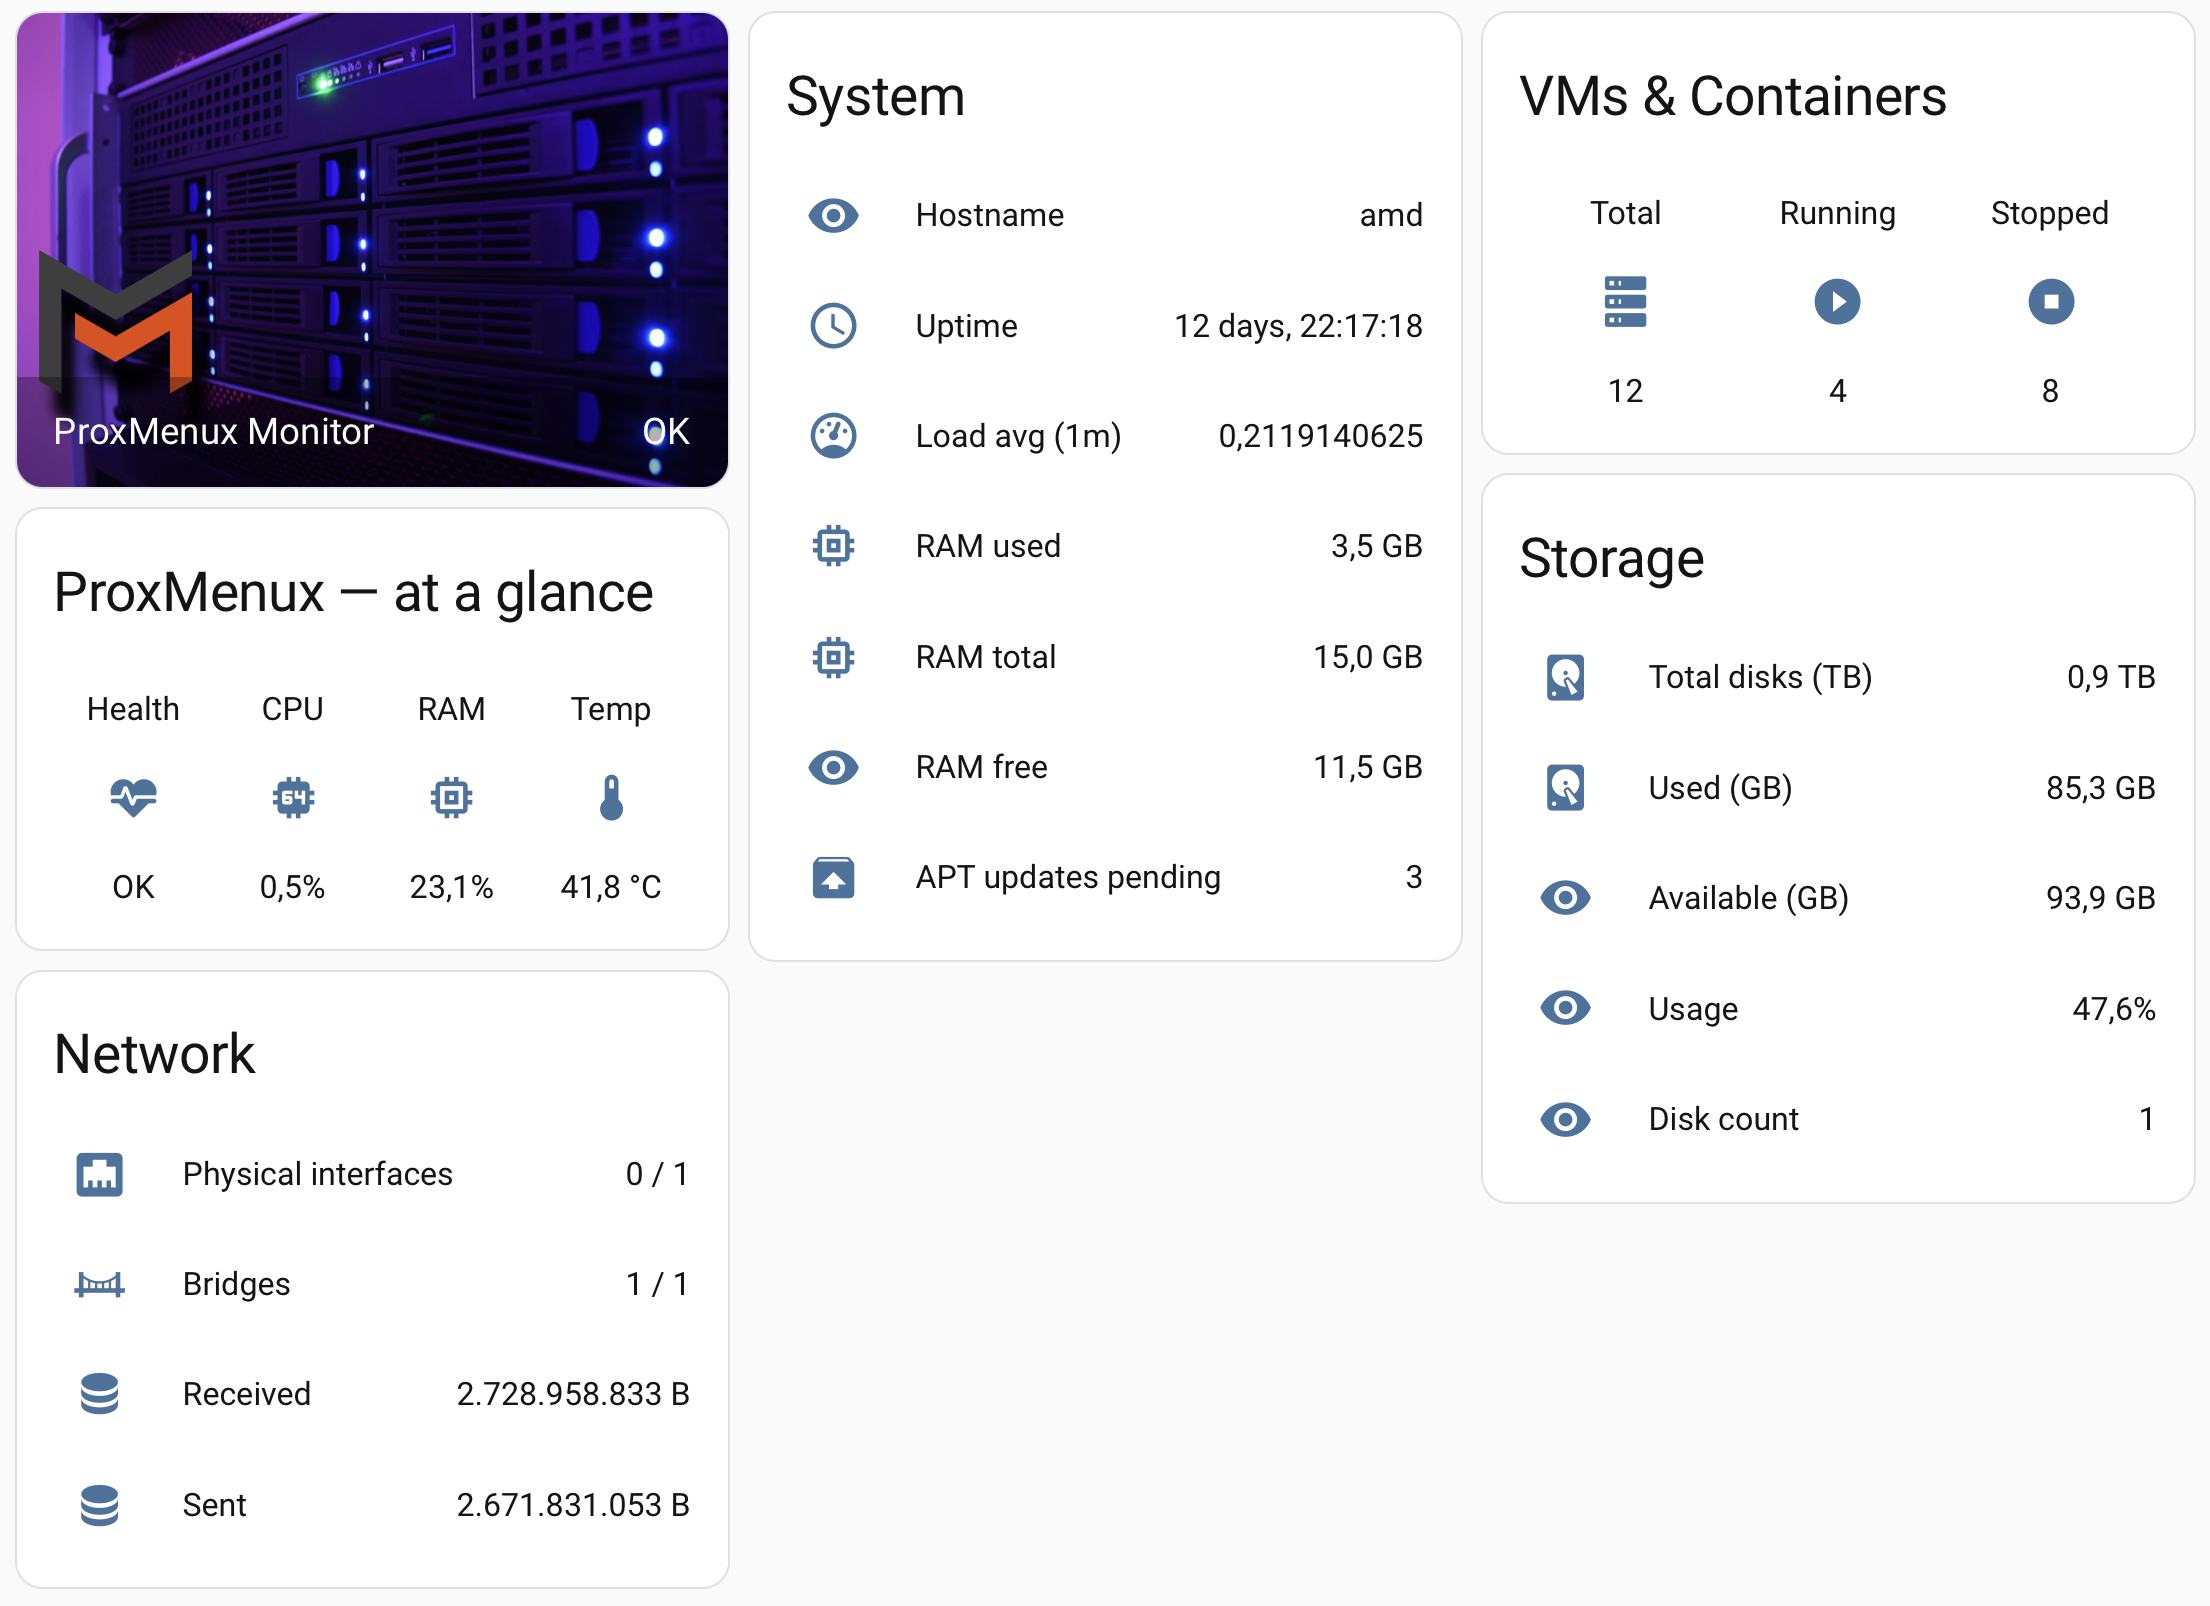
Want a fixed two-column layout instead of the auto layout?
horizontal-stack wrapping both, so they always render side by side regardless of screen width: - type: horizontal-stack
cards:
- type: entities
title: System
entities: [...]
- type: glance
title: "VMs & Containers"
entities: [...]On mobile the row stays compressed; HA's auto layout (no horizontal-stack) reflows better at narrow widths.6 · Automations
Three automations that cover the most common reactive scenarios — replace notify.mobile_app_<your_phone> with whichever notify service you use:
# automations.yaml
- alias: "ProxMenux — health degraded to WARNING"
  trigger:
    - platform: state
      entity_id: sensor.proxmenux_health
      to: "WARNING"
  action:
    - service: notify.mobile_app_<your_phone>
      data:
        title: "Proxmox: warning"
        message: >
          {{ state_attr('sensor.proxmenux_health', 'summary') }}

- alias: "ProxMenux — health CRITICAL"
  trigger:
    - platform: state
      entity_id: sensor.proxmenux_health
      to: "CRITICAL"
  action:
    - service: notify.mobile_app_<your_phone>
      data:
        title: "🚨 Proxmox CRITICAL"
        message: >
          {{ state_attr('sensor.proxmenux_health', 'summary') }}
    - service: persistent_notification.create
      data:
        title: "Proxmox CRITICAL"
        message: >
          {{ state_attr('sensor.proxmenux_health', 'summary') }}
        notification_id: proxmenux_critical

- alias: "ProxMenux — VM unexpectedly stopped"
  trigger:
    - platform: numeric_state
      entity_id: sensor.proxmenux_vms_stopped
      above: 0
      for: "00:02:00"
  action:
    - service: notify.mobile_app_<your_phone>
      data:
        title: "Proxmox: VM stopped"
        message: >
          {{ states('sensor.proxmenux_vms_stopped') }} VM(s) currently stopped
About the ProxMenux logo
The picture-entity card at the top of the Lovelace YAML pulls the official ProxMenux logo from dashboardicons.com — a free icon library curated for self-hosted dashboards. The ProxMenux entry lives at dashboardicons.com/icons/external/proxmenux. Home Assistant fetches the SVG over HTTPS on first render and caches it.
If the logo card shows a broken image
- Download the SVG from cdn.jsdelivr.net/gh/homarr-labs/dashboard-icons/svg/proxmenux.svg.
- Save it to
/config/www/icons/proxmenux.svgon your HA host. - In the Lovelace YAML, replace the
image:URL with/local/icons/proxmenux.svg. Save and reload — the image renders from the local file, no internet needed.
scan_interval rule of thumb
/api/system is cheap to call — 30 s is fine. /api/health/full uses an internal 6-min cache, so polling it more often than ~60 s gains you nothing. /api/storage/summary changes slowly — every 5 min is plenty. /api/proxmenux/update-status only matters once an hour. Tune to your hardware budget if you have many sensors across many hosts.Prometheus + Grafana
ProxMenux Monitor exposes a Prometheus-format scrape endpoint at GET /api/prometheus (authenticated) returning OpenMetrics text. Wire it into Prometheus, then build a Grafana dashboard on top — same data the dashboard UI shows, in the format your TSDB expects.
1 · Add the scrape job to Prometheus
Pass the API token via Prometheus' native authorization block (cleaner than custom headers and works with secret stores):
# /etc/prometheus/prometheus.yml
scrape_configs:
  - job_name: 'proxmenux'
    metrics_path: /api/prometheus
    scheme: https              # http if TLS isn't enabled in the Monitor
    scrape_interval: 30s
    authorization:
      type: Bearer
      credentials: 'your_actual_api_token_here'
    static_configs:
      - targets:
          - 'pve01.lan:8008'
          - 'pve02.lan:8008'
          - 'pve03.lan:8008'
Reload Prometheus (kill -HUP or systemctl reload prometheus, or docker compose restart prometheus if you run it as a container) and check Status → Targets — the proxmenux job should turn green within one scrape interval. Each metric carries a node="<hostname>" label so you can distinguish hosts in queries.
Token via file or env, not inline
credentials_file: /etc/prometheus/secrets/proxmenux.token as an alternative — keep the token in a 0600 file and let Prometheus read it.2 · Verify the scrape with a couple of queries
Before configuring Grafana, confirm Prometheus actually has the data. Open Prometheus' own UI at http://<prometheus-host>:9090, click Query and run any of these — you should get back live numbers from your Proxmox host:
| Query | What it confirms |
|---|---|
| up{job="proxmenux"} | Returns 1 if Prometheus is successfully scraping the Monitor, 0 if not. The fastest sanity check. |
| proxmox_cpu_usage | Current CPU usage % of the Proxmox host. Should change if you refresh the query a few seconds apart. |
| proxmox_vms_running | Number of running guests. Compare against what you see in the Proxmox UI. |
| proxmox_uptime_seconds / 86400 | Host uptime in days. Should match the value you'd see in uptime on the Proxmox shell. |
The 401 you may see when clicking the endpoint URL is fine
/api/prometheus) makes your browser fetch it directly — without the bearer header that Prometheus uses for its own scrapes. So you'll see {"error":"Authentication required"}. That confirms the API is properly protected; Prometheus itself authenticates correctly because it has the token from the scrape config. Trust the green State: UP, not the click-through.3 · Add Prometheus as a Grafana data source
In Grafana: Connections → Data sources → Add new → Prometheus. Set the URL to your Prometheus instance (e.g. http://prometheus.lan:9090), save and test. No extra auth needed at this layer — Prometheus has already authenticated to ProxMenux.
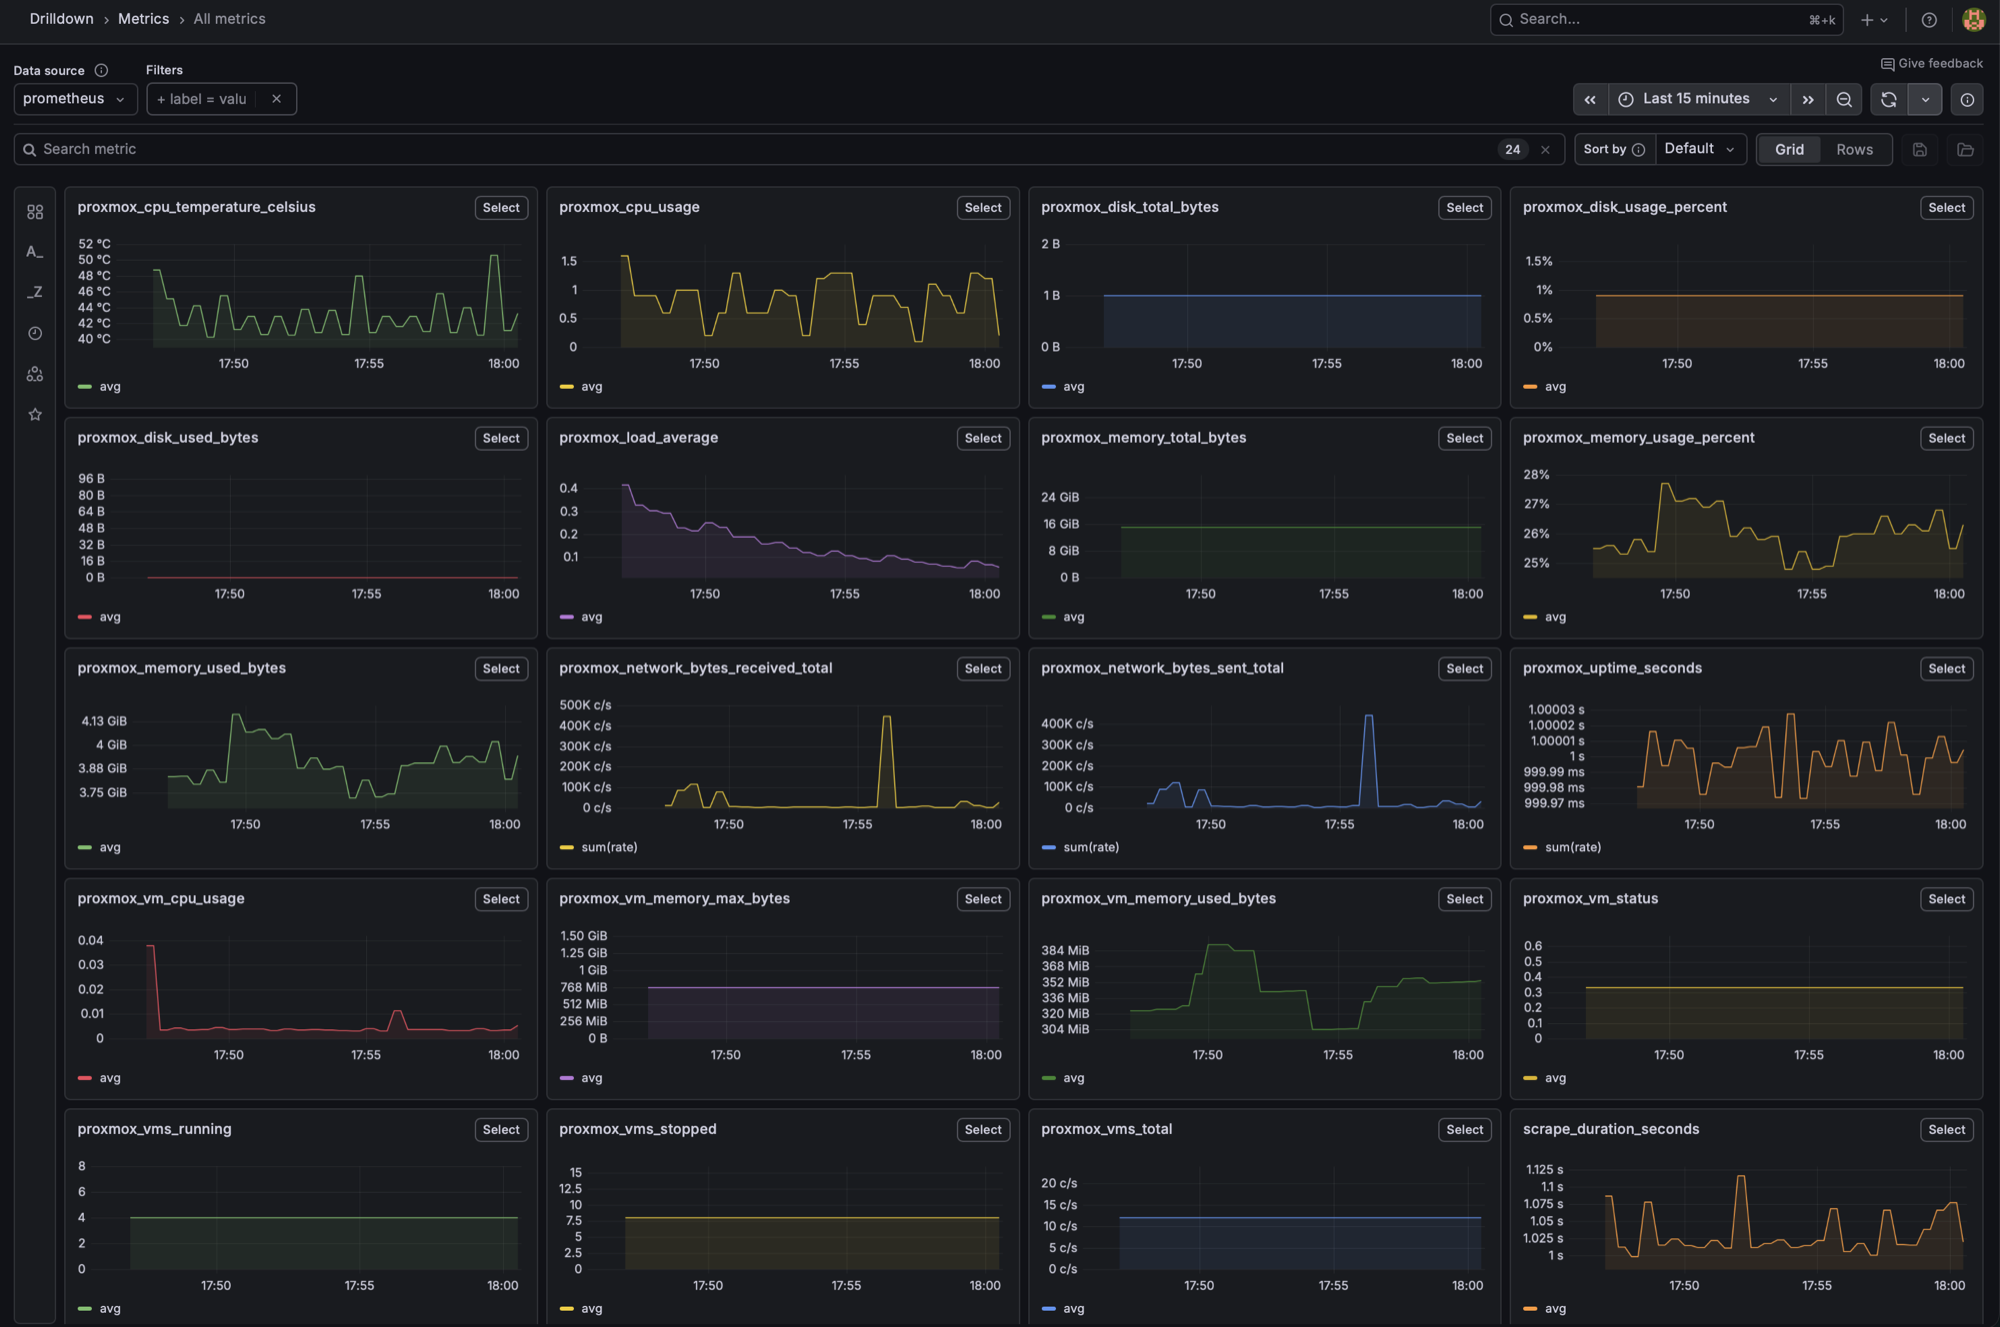
4 · Build panels with these PromQL queries
A starter set that maps directly to what users typically watch on a Proxmox host:
| Panel idea | PromQL query |
|---|---|
| CPU usage gauge per host | proxmox_cpu_usage |
| Memory usage gauge per host | proxmox_memory_usage_percent |
| Memory used vs total (timeseries) | proxmox_memory_used_bytes / 1024 / 1024 / 1024 |
| Running VMs / CTs per host | proxmox_vms_running |
| CPU temperature | proxmox_cpu_temperature_celsius |
| Network throughput RX (bytes/s) | rate(proxmox_interface_bytes_received_total[5m]) |
| Network throughput TX (bytes/s) | rate(proxmox_interface_bytes_sent_total[5m]) |
| Load average (1m) | proxmox_load_average{period="1m"} |
| Disk space used % per mountpoint | proxmox_disk_usage_percent |
| UPS battery charge | proxmox_ups_battery_charge_percent |
| GPU temperature per slot | proxmox_gpu_temperature_celsius |
Add each query as a Grafana panel, set the right visualization (Stat for gauges, Time series for trends), and group panels into rows by category. Use the node label as a dashboard variable (Settings → Variables → New → Query → label_values(proxmox_cpu_usage, node)) to filter all panels by host.
Uptime Kuma and other status checkers
For external probes, use GET /api/system-info — it is the one endpoint that works without a token, returning a small JSON payload with hostname, uptime and the overall health status (mapped to healthy / warning / critical). That's exactly what a keyword-based monitor needs.
Uptime Kuma — HTTP keyword monitor
- In Uptime Kuma, click + Add New Monitor.
- Monitor Type: HTTP(s) - Keyword.
- Friendly Name: ProxMenux Monitor — pve01.
- URL:
http://pve01.lan:8008/api/system-info. - Keyword:
healthy(the value ofhealth.statuswhen the host is OK). - Heartbeat Interval: 60 seconds is enough.
- Save. No headers needed — the endpoint is public.
# Verify the response shape — no token required
curl http://pve01.lan:8008/api/system-info | jq
# → { "hostname": "...", "uptime": "...", "health": { "status": "healthy", ... }, ... }

# A failing scriptable check (non-zero when the Monitor isn't reporting healthy)
curl -s http://pve01.lan:8008/api/system-info | jq -e '.health.status == "healthy"'
healthchecks.io / cron-style pings
Same endpoint, same shape — point your cron-style ping at /api/system-info and assert .health.status == "healthy". Most of these services accept a 2xx HTTP status as the "up" signal too, in which case even a curl without parsing is enough.
Want richer health data
GET /api/health/full instead — that one needs an API token but gives you everything the dashboard modal renders in a single response.n8n, Zapier and custom scripts
For workflow tools and ad-hoc scripts that need to raise notifications through the Monitor (a CI failure, a smart-home sensor, a cron job that ran too long), the recipe is one POST to /api/notifications/send. The event flows through the same dispatch pipeline as anything emitted internally — dedup, cooldown, optional AI rewrite, fan-out to the configured channels.
# A nightly cron job reports it ran longer than its threshold
curl -X POST http://proxmox.example.tld:8008/api/notifications/send \
  -H "Authorization: Bearer your_actual_api_token_here" \
  -H "Content-Type: application/json" \
  -d '{
    "event_type":"system_problem",
    "severity":"WARNING",
    "title":"Nightly rsync took 4h27m",
    "body":"The nightly-rsync job exceeded the 2h alert threshold. Check the source storage.",
    "data":{
      "service_name":"nightly-rsync",
      "hostname":"backup-host"
    }
  }'
In n8n, the equivalent is an HTTP Request node with method POST, the URL above, an Authorization header set to Bearer {'{$credentials.proxmenux.token}'} (using n8n credentials), and a JSON body matching the curl payload. Wire any preceding node as the trigger (cron, webhook, condition).
Severity values are INFO, WARNING or CRITICAL (uppercase). The data payload is free-form JSON — the AI rewriter, when enabled, will pull anything useful from it for the rendered body. Full event-type semantics live in Notifications → Event catalogue.
Native Proxmox VE webhook (inbound)
Proxmox VE 8.1+ has its own notification system. ProxMenux Monitor registers itself as a webhook target so that everything PVE emits on its own (HA fencing, replication, vzdump from the GUI, certificate renewal) lands in the same dispatch pipeline as the Monitor's own events. This happens automatically when you press Enable Notifications on the Settings tab — no integration work required on the user side.
Mechanics, the body template PVE sends, the entries written to /etc/pve/notifications.cfg, and behaviour in clusters are documented in Notifications → PVE webhook integration.
Where to next
- API Reference — every endpoint with method, path and the full Prometheus metric catalogue.
- Notifications — event sources, channels, the dispatch pipeline, the PVE webhook integration in detail.
- AI Assistant — the optional rewriter that turns templated bodies into plain language before they reach Telegram / Discord / email / Gotify.
- Access & Authentication — minting and revoking the API tokens these recipes consume, audit log, TLS configuration.