Notifications
The fan-out engine that takes events from every collector inside the Monitor and delivers them to Telegram, Discord, Email, Gotify and ~80 extra services via Apprise — with deduplication, cooldown, burst aggregation, per-event and per-channel toggles, an optional AI rewriter, and a queryable history.
Where messages come from
How it works
Every notification follows the same path through the Monitor process. Events are produced by a handful of independent collectors, normalised into a structured payload, passed through a dispatch pipeline that decides whether to send and in what shape, optionally rewritten by an LLM, and finally fanned out to whichever channels the user has configured.
High-level flow. Every actual dispatch attempt — successful, aggregated or failed — is recorded in the SQLite history table for retrospective inspection. Events suppressed by the cooldown stage are not logged.
Enabling the panel
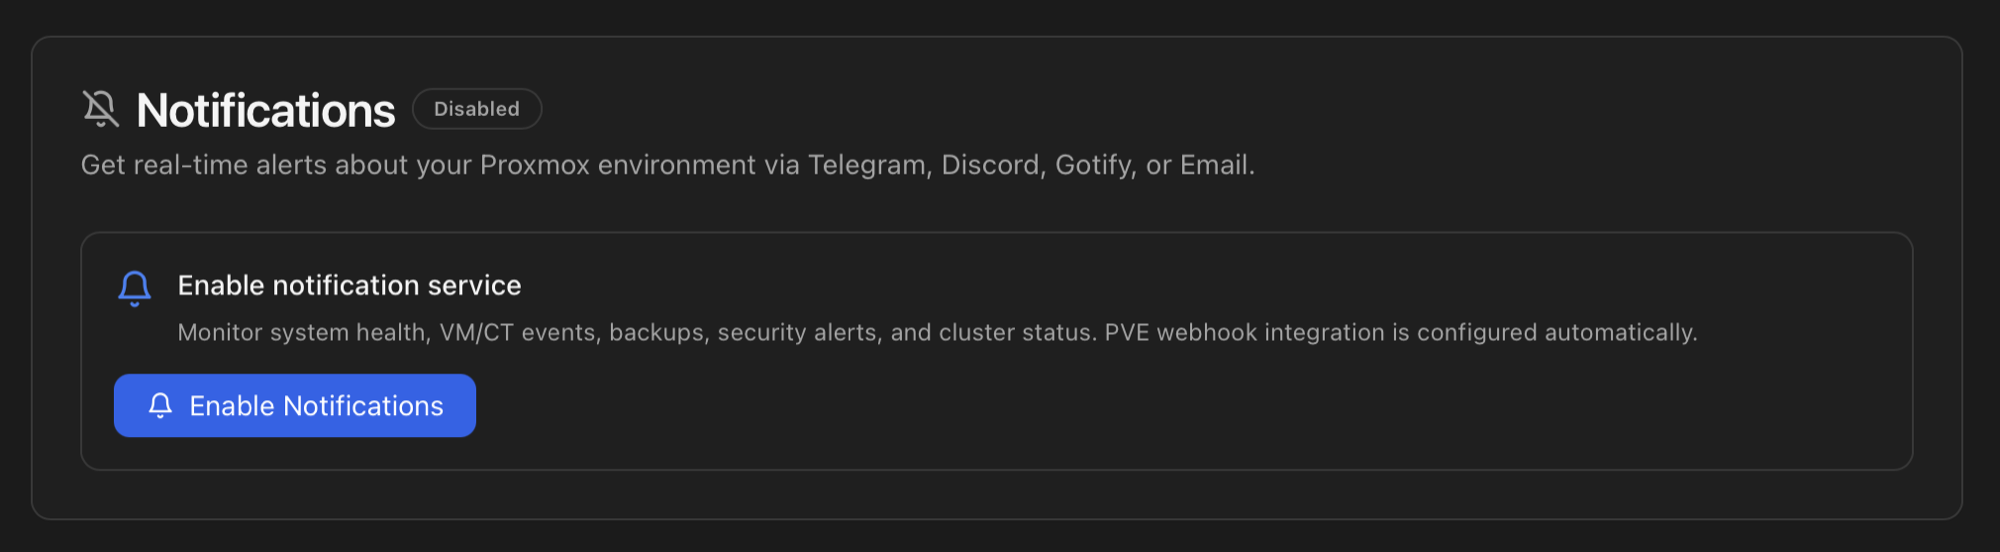
On a fresh install the Notifications card on the Settings tab shows a Disabled badge and a single Enable Notifications button. Nothing is dispatched and no PVE config is touched until you press it.
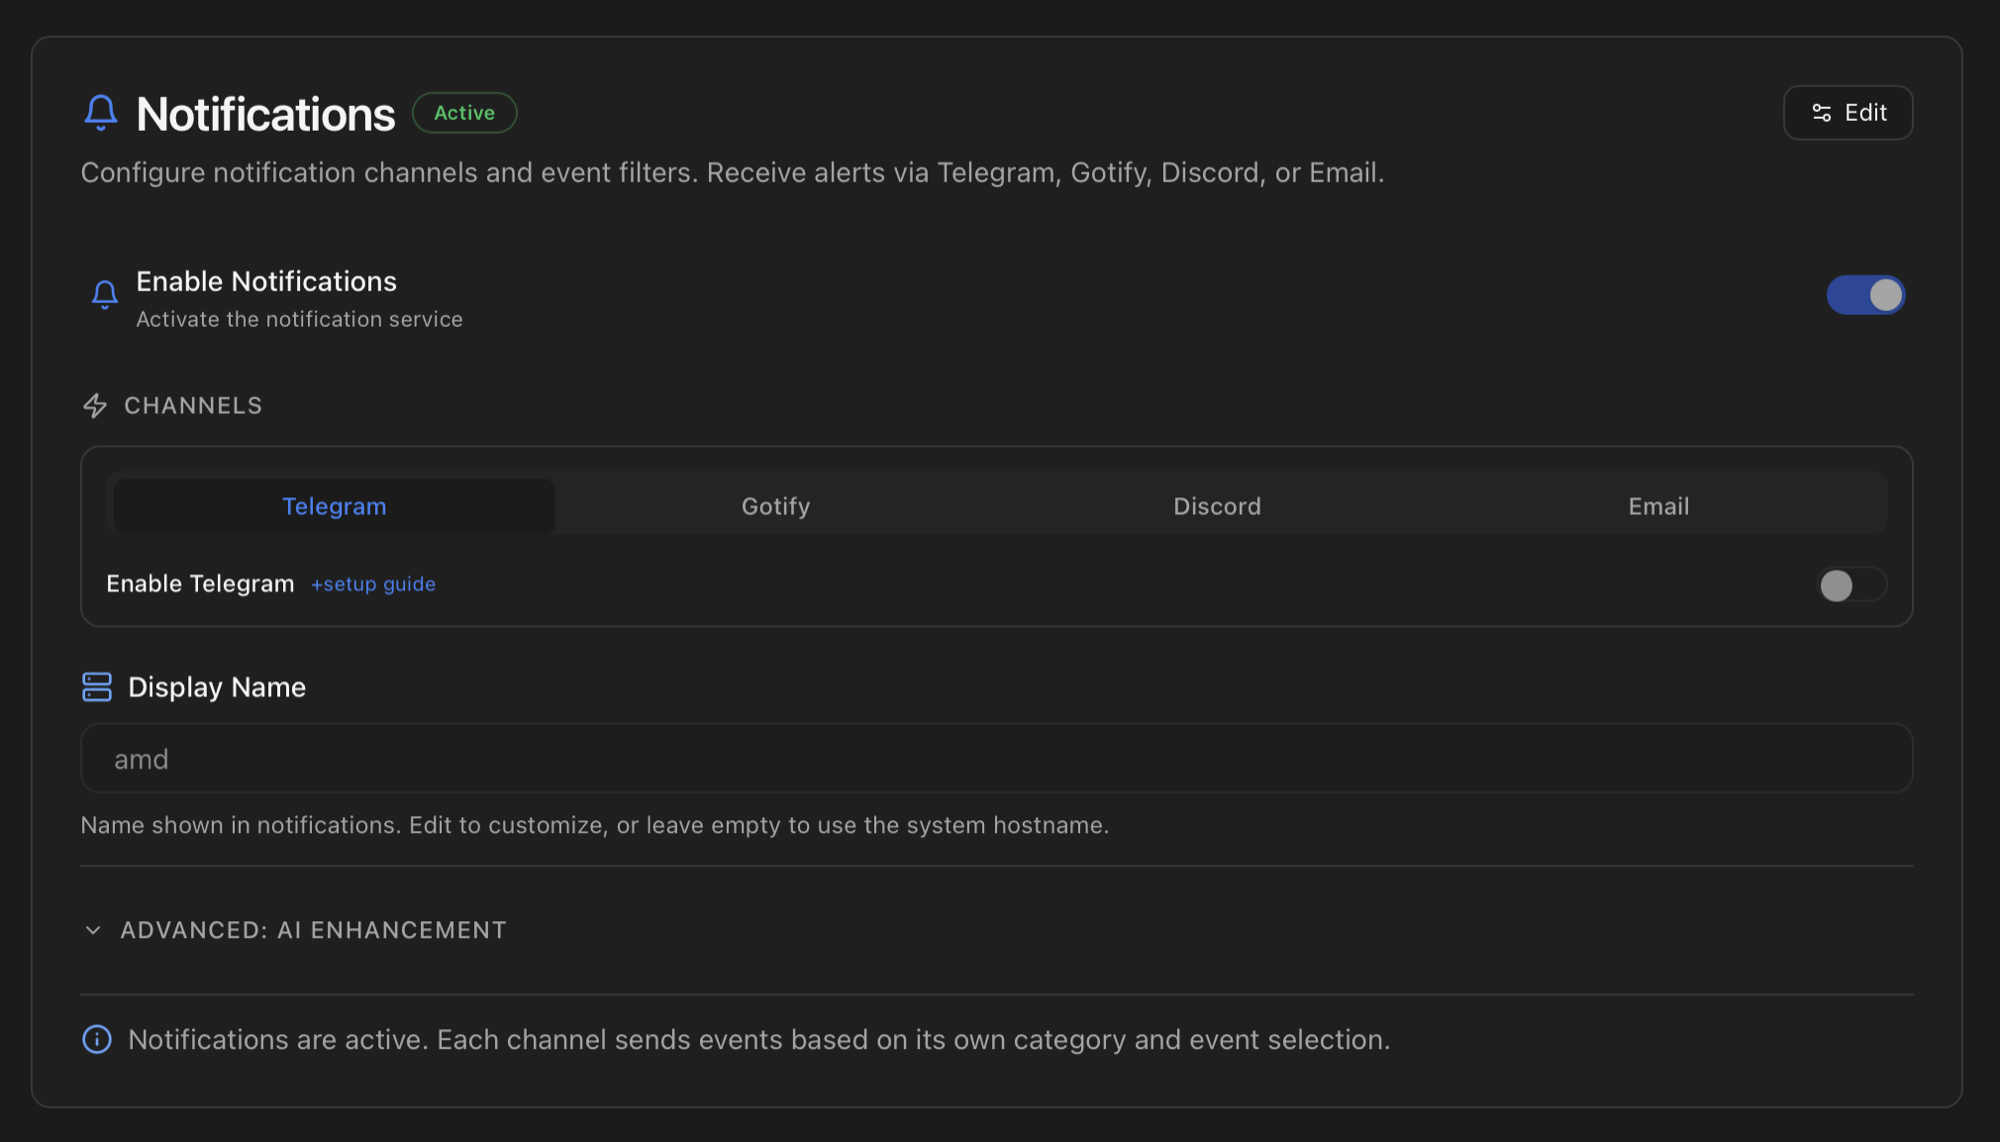
Pressing the button does three things in sequence:
- Flips the panel to its Active state and unfolds the channel form below.
- Registers a Proxmox VE webhook target in
/etc/pve/notifications.cfgpointing atPOST http://127.0.0.1:8008/api/notifications/webhook. From this moment on, anything Proxmox VE emits on its own (HA, replication, vzdump from the GUI) flows into the same pipeline as the Monitor's own events. See PVE webhook integration below for the full mechanics. - Starts the dispatch background thread. The thread polls the event queue and walks every event through the pipeline diagrammed above.
Event sources
Six independent collectors feed the notification engine. They run as background threads inside the Monitor process and emit a structured NotificationEvent every time something happens.
| Collector | Watches | Typical events |
|---|---|---|
| Health Monitor | Ten categories, every 5 minutes | new_error, error_resolved, error_escalated, health_degraded, health_persistent. |
| Journal watcher | journalctl --follow with pattern matching for SSH / web auth failures, Fail2Ban bans (when the optional jail is installed), kernel I/O errors, OOM, smartd events. | auth_fail, ip_block, oom_kill, disk_io_error, service_fail. |
| Task watcher | Polls /var/log/pve/tasks/index for new task UPIDs and follows their per-file logs. | backup_start, backup_complete, backup_warning, backup_fail, migration_*, snapshot_complete. |
| Proxmox webhook hook | Listens on POST /api/notifications/webhook. Proxmox VE 8.1+ pushes its own notifications here once the integration is set up (see below). | Anything PVE emits — including events the Monitor would otherwise miss (HA, replication, vzdump from the GUI). |
| Polling collector | Periodic comparisons (cluster nodes online, certificate expiry, GPU passthrough state, PVE / ProxMenux update availability). | node_disconnect, node_reconnect, pve_update, proxmenux_update, gpu_mode_switch, pci_passthrough_conflict. |
| In-process emitters | Direct calls from ProxMenux scripts and from the Monitor itself (notification_manager.emit_event(...)). | system_startup, system_shutdown, system_reboot, ai_model_migrated, custom test events. |
Every event carries a stable event_type (the catalogue is below), a severity (INFO, WARNING, CRITICAL), a category (used for emoji enrichment and per-group filters) and a data payload with anything the template needs (vmid, device, source_ip, reason…).
Each event_type has a matching template in notification_templates.py that renders the structured event into a plain-text body before anything else happens. That templated body is what travels through the dispatch pipeline, and what the optional AI layer rewrites if enabled. See the AI Assistant page for how the rewrite layer interacts with this templated body.
Channel walkthroughs
Five channels are currently supported: Telegram, Discord, Gotify, Email (SMTP) and Apprise. The first four are native — each one has its own tab inside the Notifications panel with a + setup guide link opening an in-app modal. Apprise is a generic hub that adds ~80 additional services (ntfy, Matrix, Pushover, Slack, Teams, Pushbullet, AWS SNS, Mattermost…) through a single URL field. They are all documented step by step below.
Where credentials live
/usr/local/share/proxmenux/. They never leave the host except to reach their respective services. A backup of that directory is enough to recover the configured channels.Telegram
Two pieces of information are required: a Bot Token (one per bot, reusable across chats) and a Chat ID (where the bot should post — your private chat, a group, or a topic inside a supergroup). The in-app guide below contains the full step-by-step; the rest of this section repeats it as text plus the two shapes the Chat ID can take.
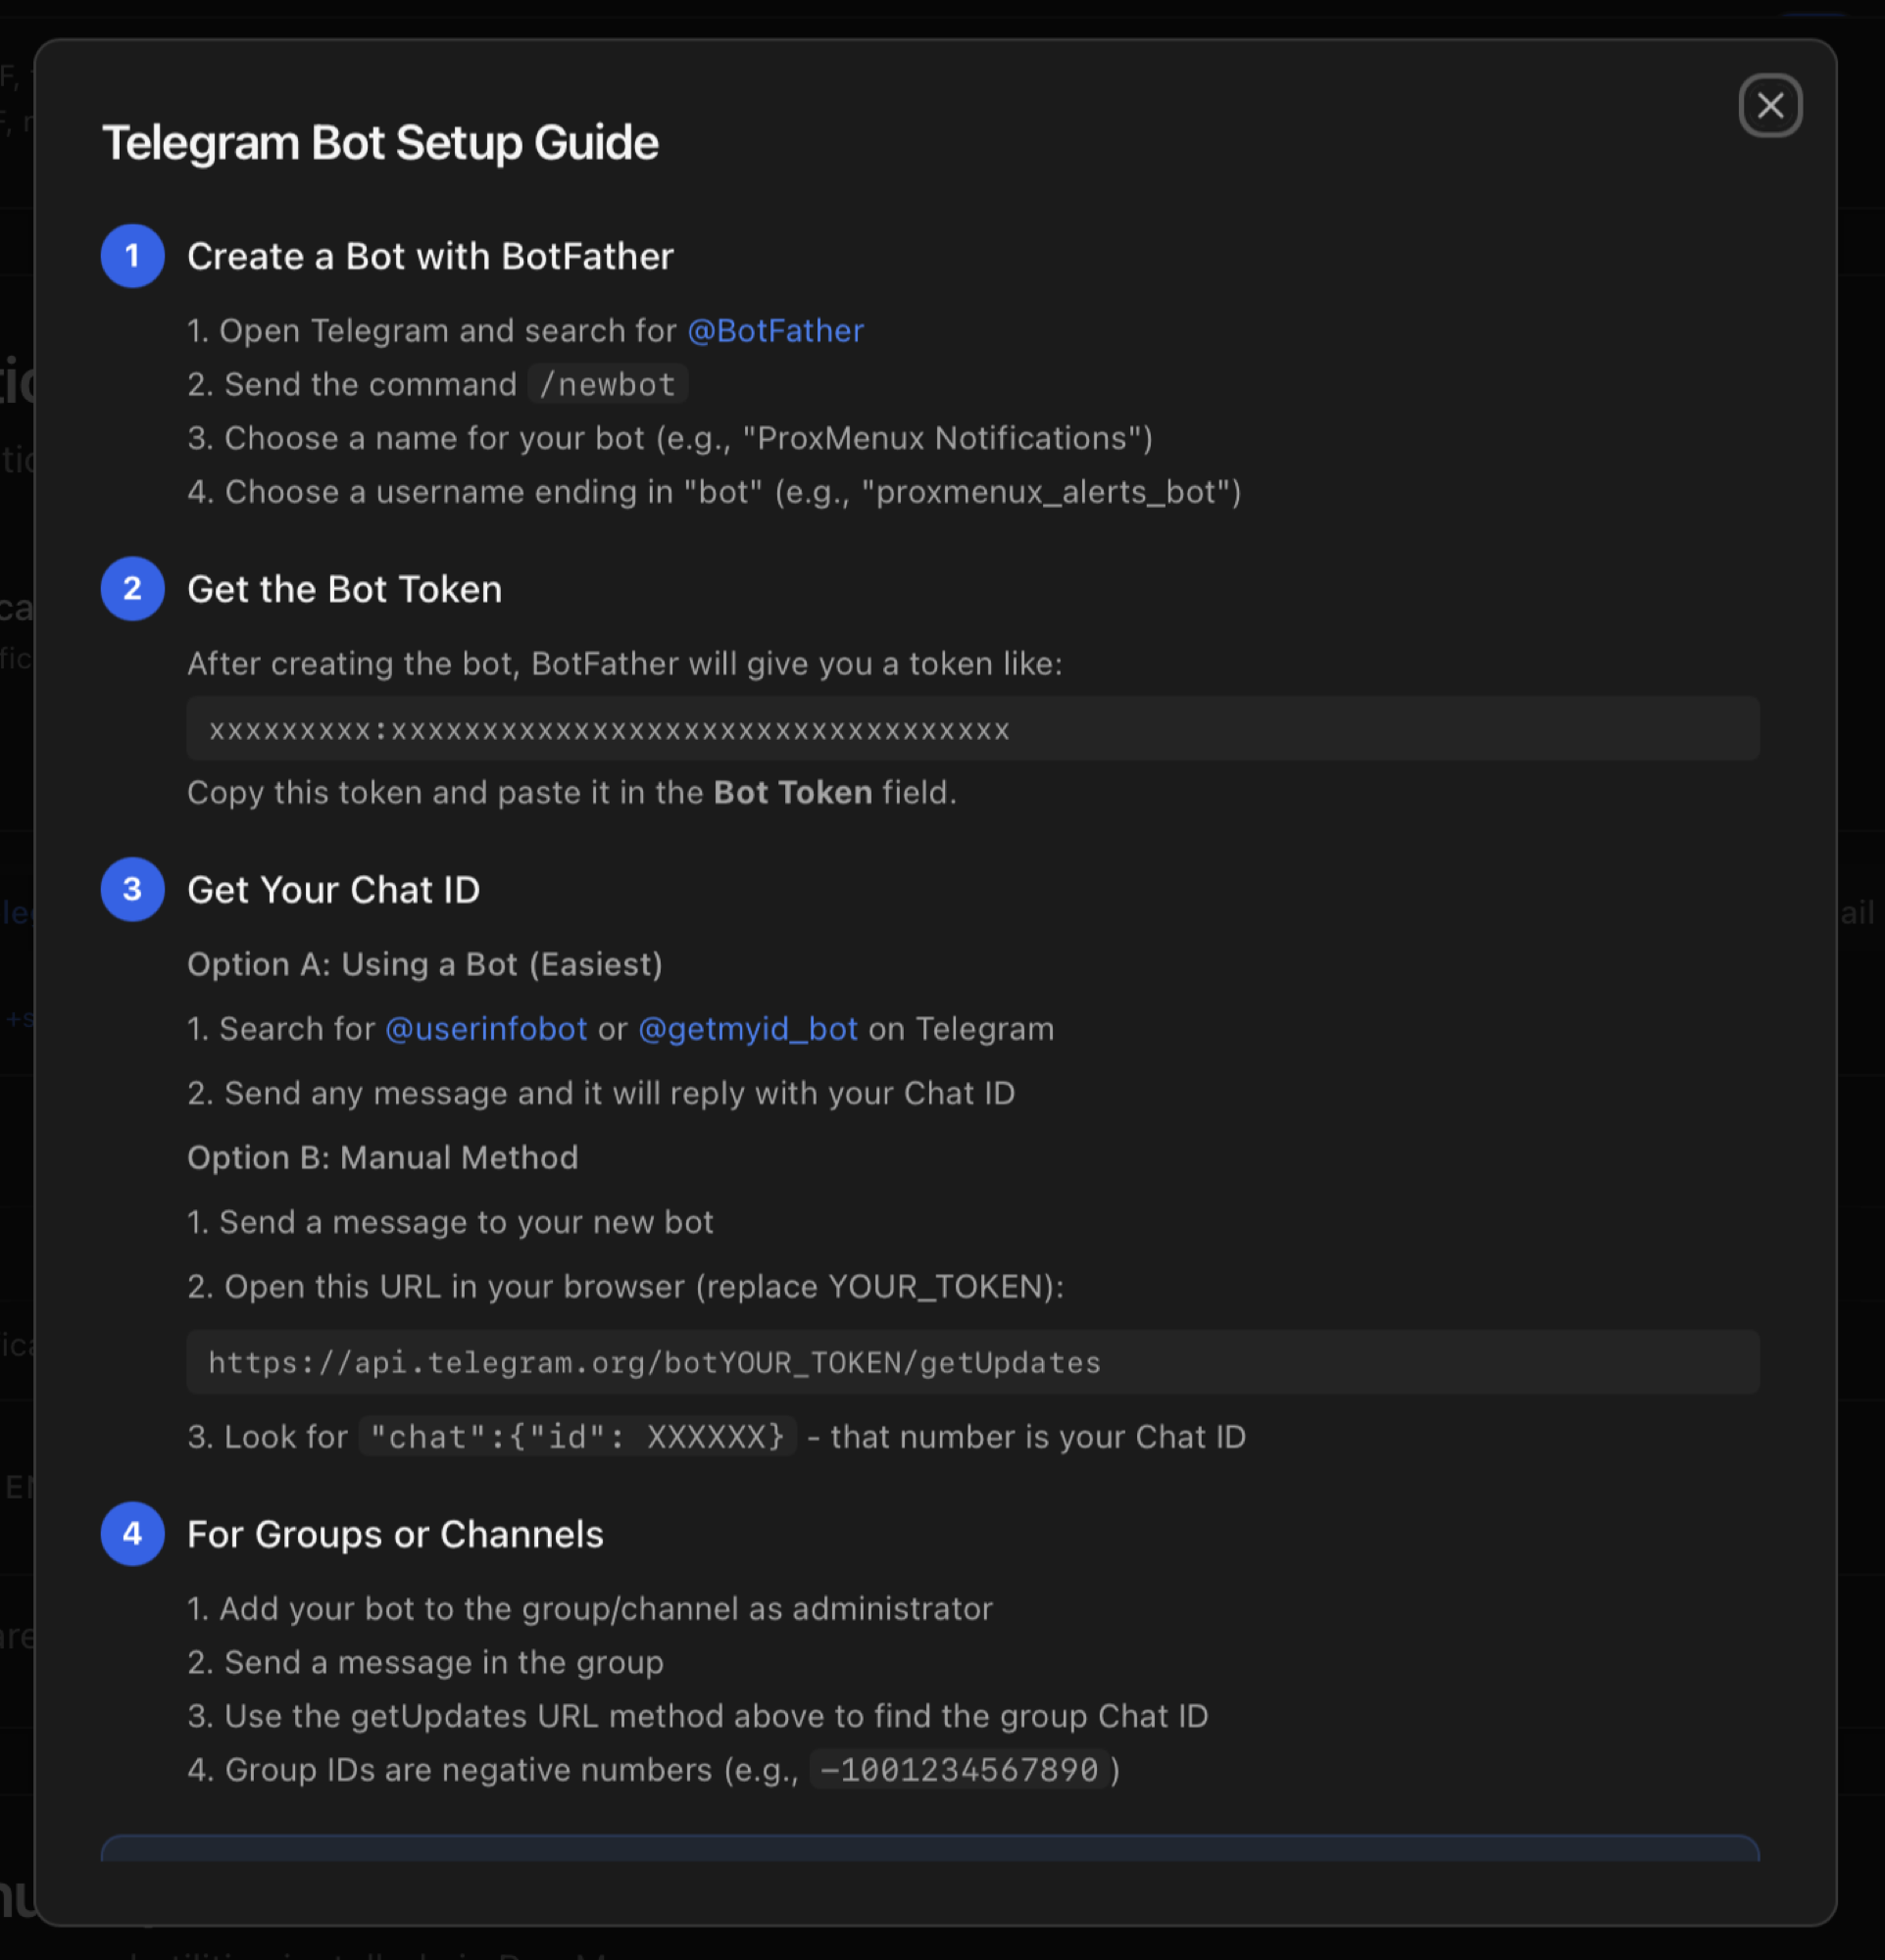
1 · Create a bot with BotFather
- Open Telegram and start a chat with @BotFather (the one with the blue verification tick — copies are common).
- Send
/newbot. - Pick a display name (e.g. ProxMenux Lab). It can be changed later.
- Pick a username ending in
bot(e.g. proxmenux_lab_bot). It must be unique across Telegram. - BotFather replies with a token of the form
123456789:ABCdef…— that is the Bot Token. Treat it as a password.
2 · Get the Chat ID
The Chat ID identifies where the bot posts. It takes one of two shapes depending on the target.
Private chat (you receive the alerts on your own account):
- Start a chat with your new bot and send any message (e.g.
/start). - Open a chat with @userinfobot (or @myidbot) and send
/start. It replies with your numeric user ID — that is the Chat ID. It is a positive number.
Group or supergroup with topics:
- Add the bot to the group as a member (and make it admin if the group requires it to post).
- Send any message in the group.
- Open
https://api.telegram.org/bot<YOUR_TOKEN>/getUpdatesin a browser. Look forchat.idin the JSON response — for groups it is a negative number, for supergroups it starts with-100. - For supergroups with Topics enabled, also note the
message_thread_idof the topic you want to target — that goes in the optional Topic ID field.
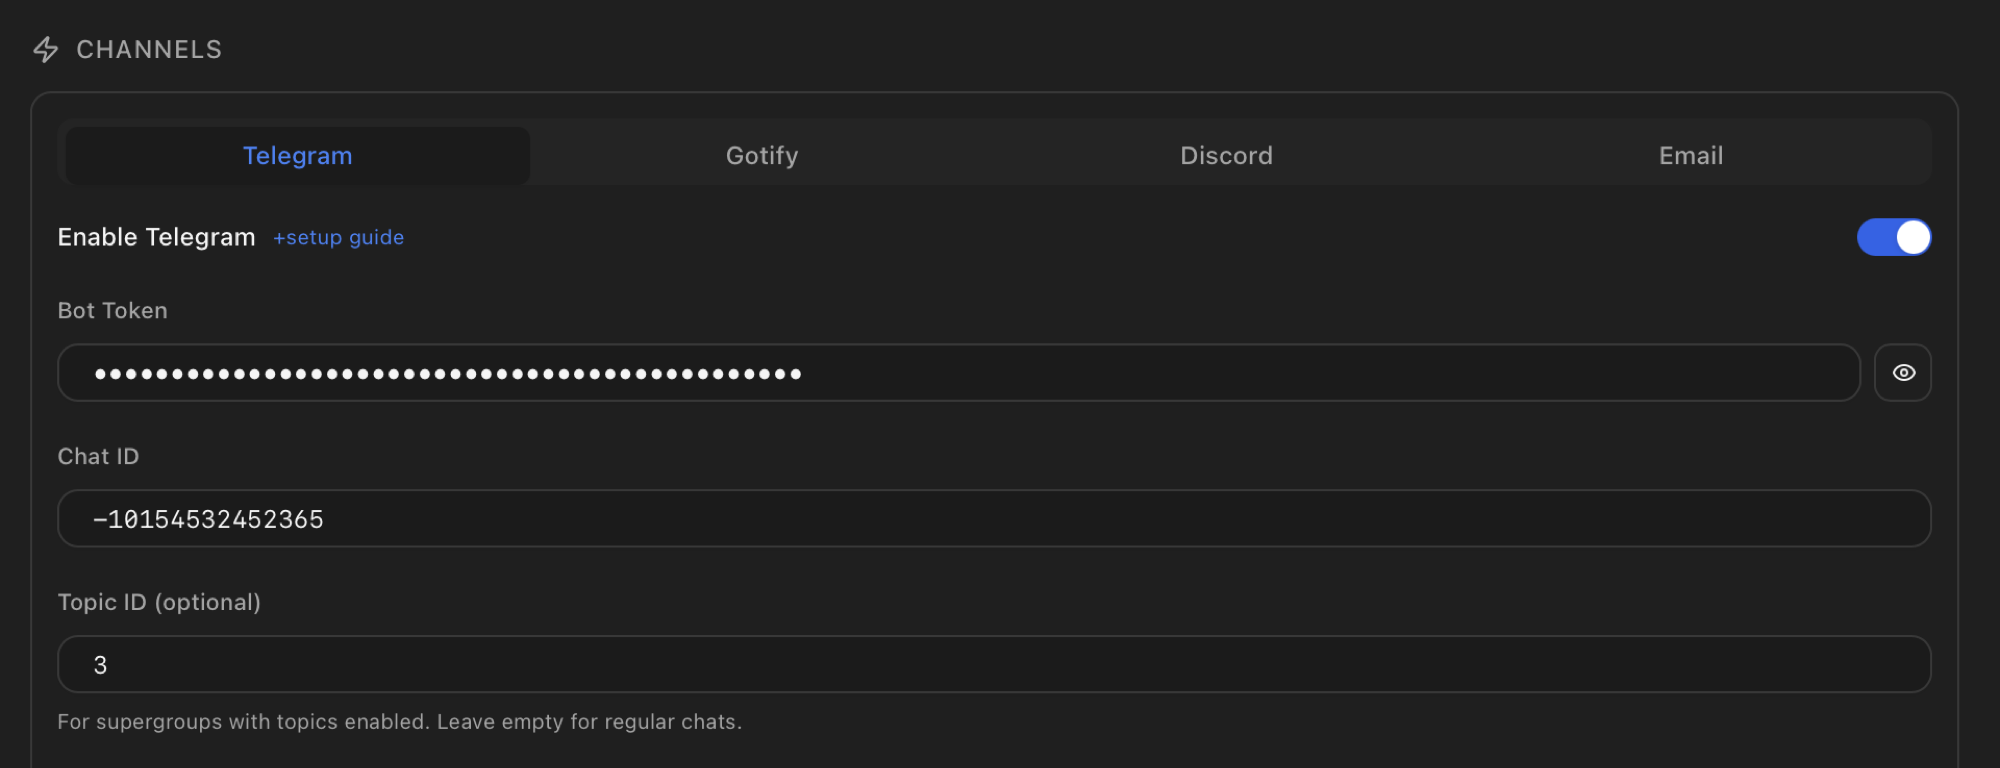
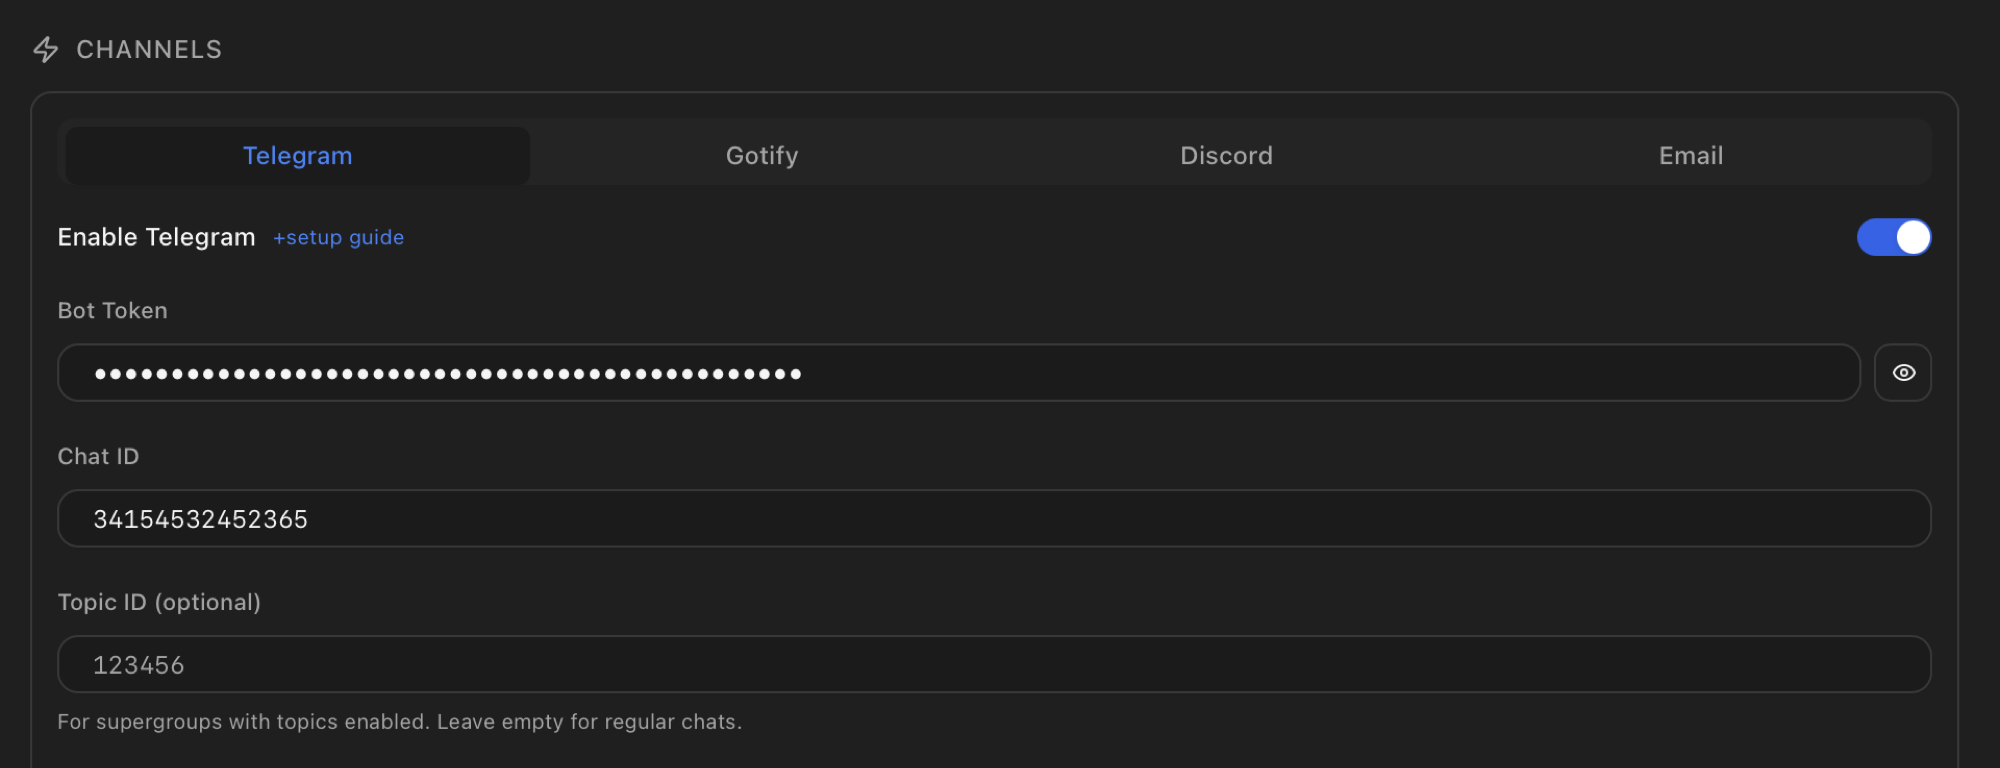
-100… and the optional Topic ID targets a specific thread.3 · Save and test
Paste the Bot Token and Chat ID into the Telegram tab, save, and press Send Test at the bottom of the panel. A test message should arrive within a second; if it doesn't, the History section records the failure with the exact reason (invalid token, bot not in group, blocked by user, etc.).
Discord
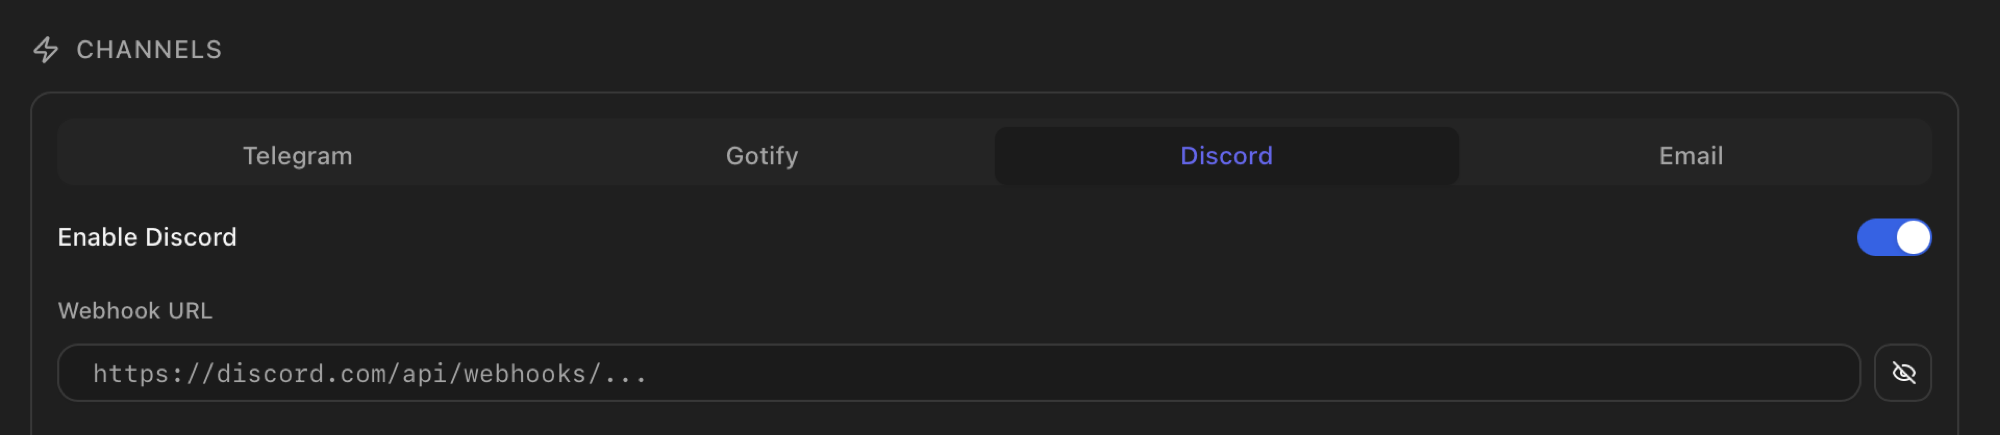
Discord channels accept incoming messages through a Webhook URL tied to a single channel. The Monitor needs that URL and nothing else.
- In Discord, open the server where you want notifications to land and go to Server Settings → Integrations → Webhooks.
- Click New Webhook. Give it a name (e.g. ProxMenux) and pick the channel it should post to. An avatar is optional.
- Click Copy Webhook URL — it looks like
https://discord.com/api/webhooks/<id>/<token>. - Paste it in the Webhook URL field of the Discord tab in the Notifications panel and save.
Gotify
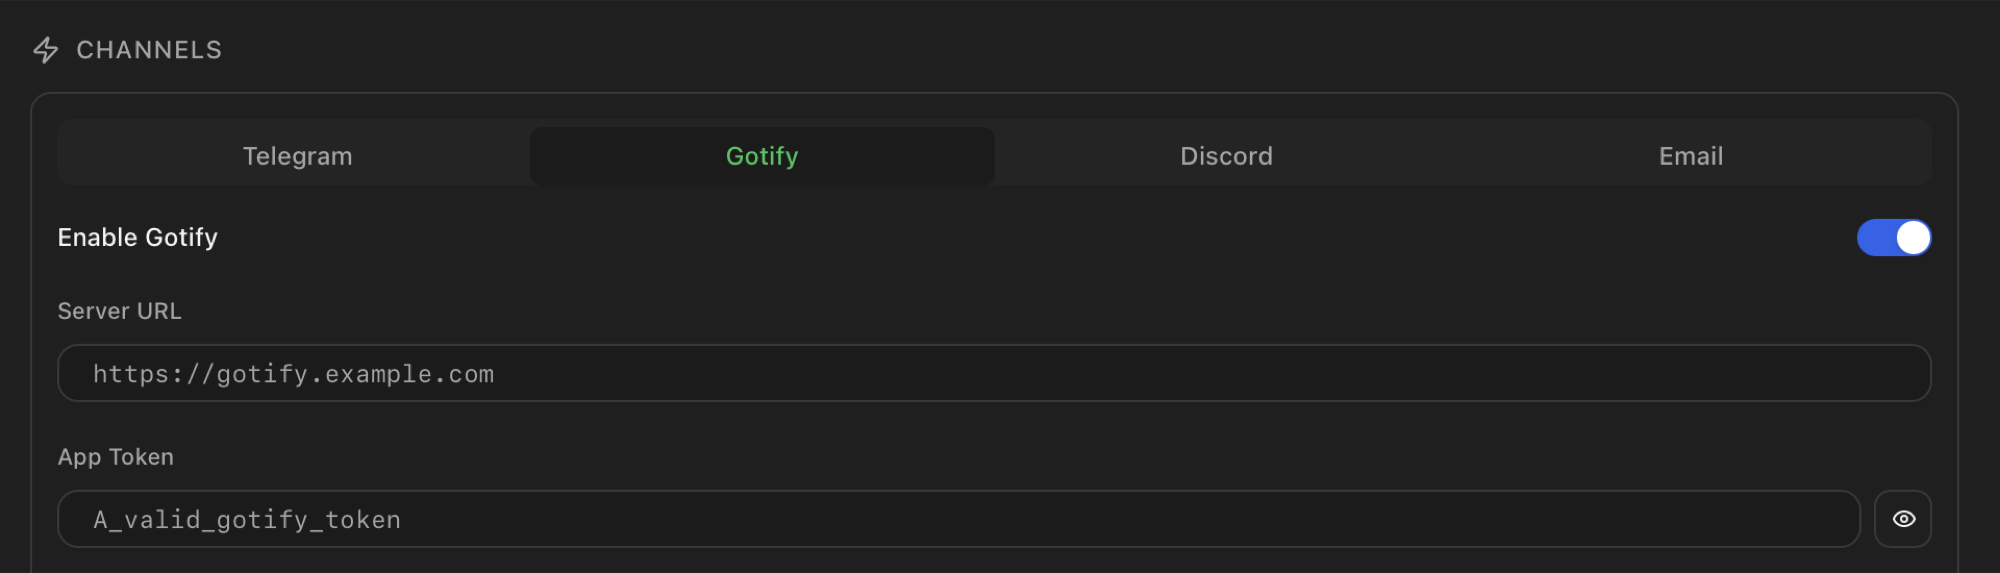
Gotify is a self-hosted push server. You need its base URL and an Application Token generated from the Gotify admin UI.
- If you don't already have a Gotify instance, install one — see the official install guide.
- Open the Gotify web UI, log in as admin, go to Apps → Create Application. Give it a name (e.g. ProxMenux). Gotify generates a token — copy it.
- In the Gotify tab of the Notifications panel, set Server URL to the base URL of your instance (e.g.
https://gotify.example.com) and paste the App Token. - Save and press Send Test.
Email (SMTP)
Email is the most flexible channel — and the one with the most fields. You need an SMTP server, a port, a TLS mode, optionally a username and password, a sender address and at least one recipient.
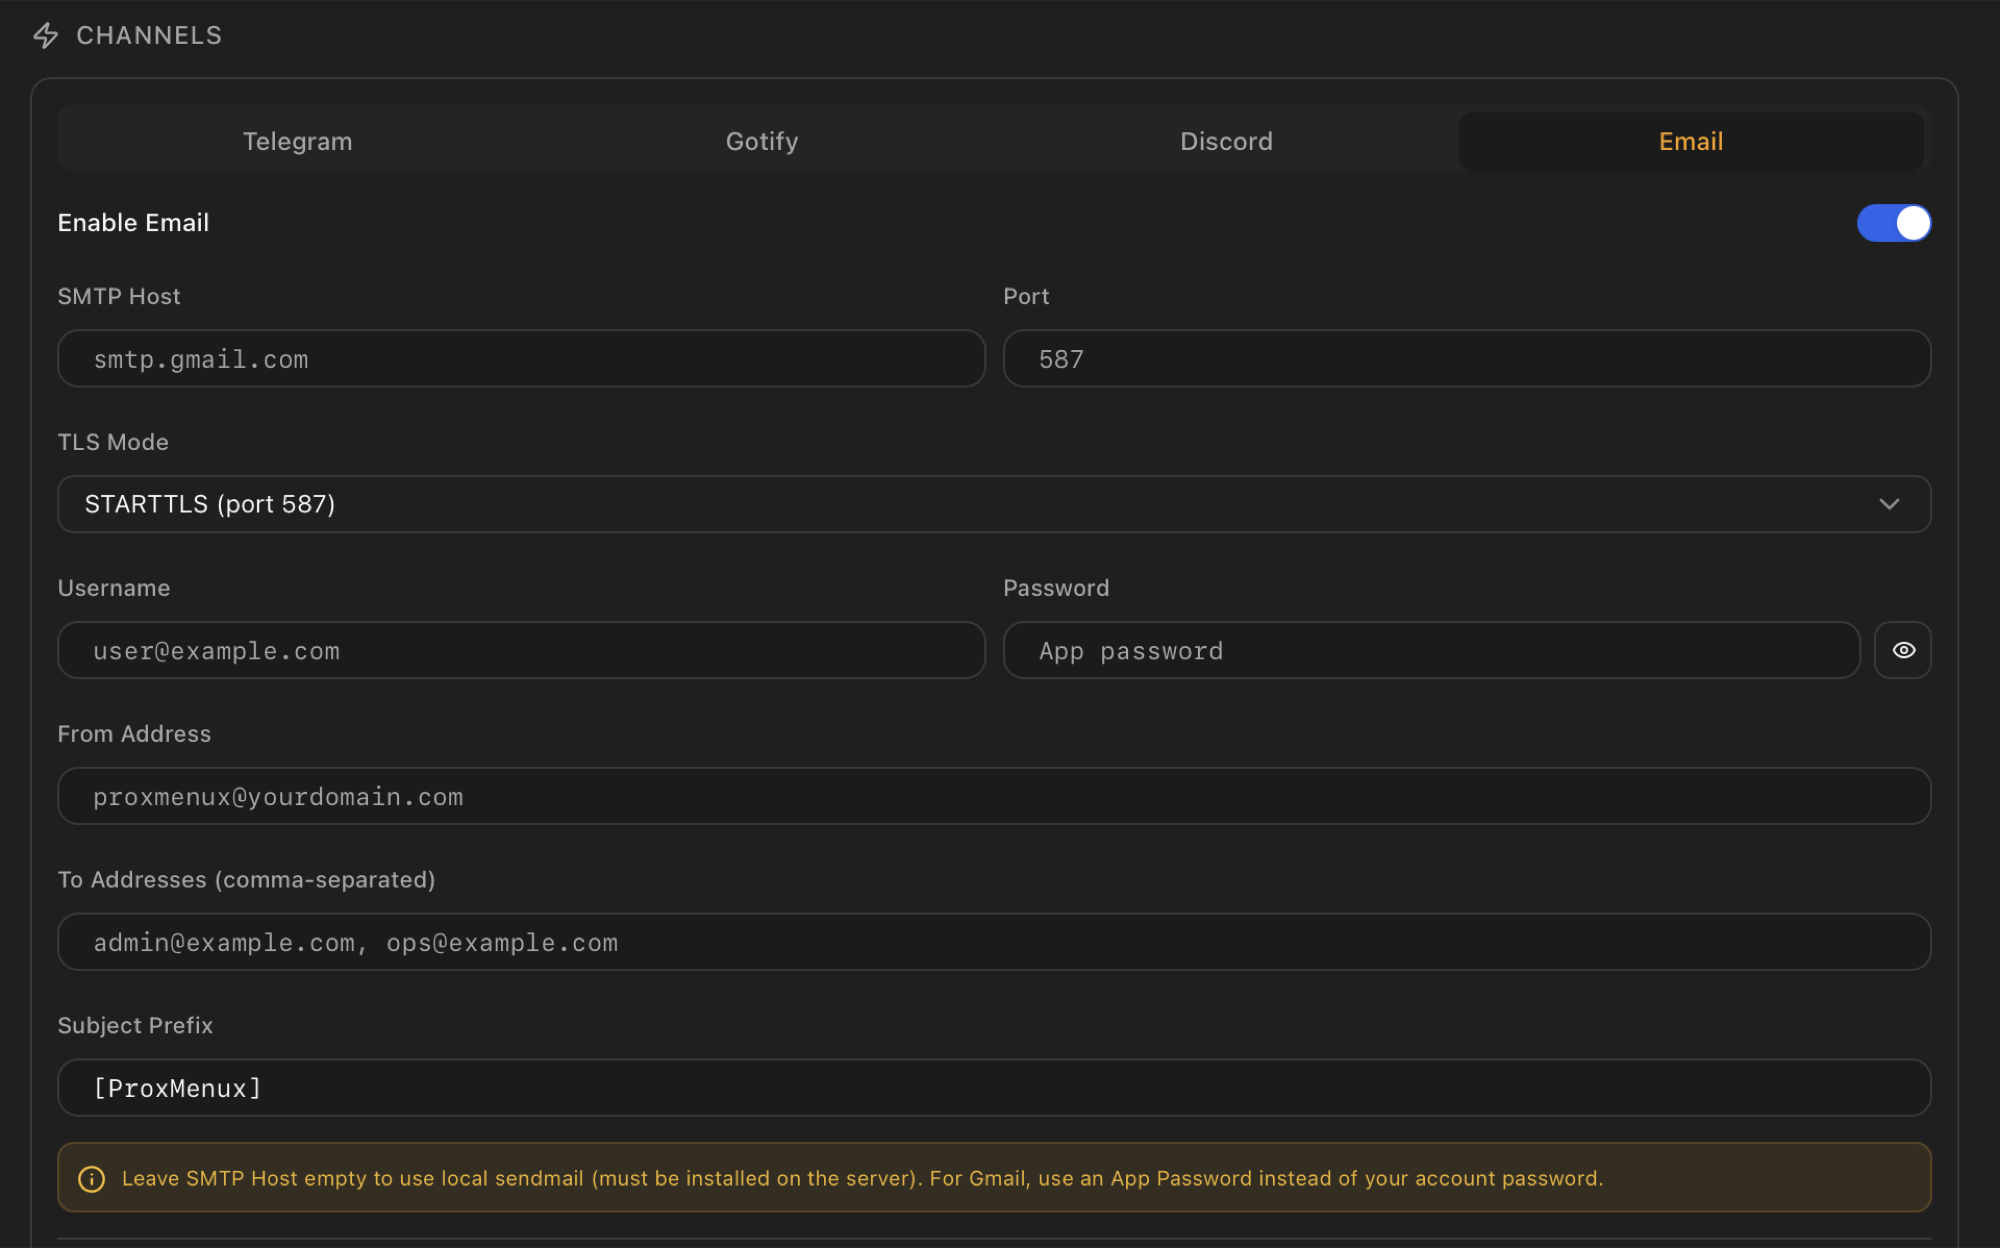
If you use a personal Gmail or Microsoft 365 account, the password field cannot be your normal account password — both providers require an app password generated specifically for third-party clients. The two flows are below.
Gmail app password
Gmail app passwords require 2-Step Verification to be active on the Google account. If it isn't, the App passwords page won't exist.
- Open myaccount.google.com/security and turn on 2-Step Verification if it's not already on.
- Go to myaccount.google.com/apppasswords.
- Type a name (e.g. ProxMenux) and click Create. Google shows a 16-character password — copy it.
- Fill the Email tab with: Host
smtp.gmail.com, Port587, TLS ModeSTARTTLS, Username your Gmail address, Password the 16-character app password.
Microsoft / Outlook app password
Microsoft now requires two-step verification on the personal account before an app password can be created. Enterprise tenants where the admin has disabled SMTP basic auth need a different path (OAuth2) which is not currently supported by the Monitor — point those at an SMTP relay you control instead.
- Open account.microsoft.com/security and enable two-step verification.
- Open Advanced security options, scroll to App passwords and click Create a new app password.
- Microsoft shows a long random password — copy it.
- Fill the Email tab with: Host
smtp-mail.outlook.com, Port587, TLS ModeSTARTTLS, Username your Outlook / Microsoft 365 address, Password the generated app password.
Self-hosted SMTP relay
Apprise (generic hub for ~80 services)
Apprise is an open-source notification library that speaks the protocol of around 80 different services through a single URL format. Adding it as one more channel inside the Monitor means you can deliver alerts to services that don't have a dedicated tab — ntfy, Matrix, Pushover, Slack, Microsoft Teams, Mattermost, Pushbullet, AWS SNS, Pushsafer, Rocket.Chat, Signal API and many others — without ProxMenux having to implement each integration separately.
The full list of supported services and the exact URL format for each one lives in the official Apprise wiki:
- github.com/caronc/apprise/wiki — full index of supported services.
- URL basics — how Apprise URLs are structured.
Steps
- Pick the target service in the Apprise wiki and copy the URL template for it. Each service page shows the exact scheme to use (
ntfy://,matrix://,pover://,slack://…) plus any required tokens, channels or hostnames. - Fill in the placeholders with your own credentials. For example, an ntfy.sh topic looks like
ntfy://ntfy.sh/my-topic; a Pushover URL looks likepover://user@token; a Matrix URL looks likematrix://user:pass@host:port/#room. - Paste the final URL into the Apprise URL field in the Apprise tab of the Notifications panel and save.
- Press Send Test to verify the URL is reachable and the credentials are accepted.
What gets delivered
One URL per Apprise channel
Rich messages, categories and per-channel filtering
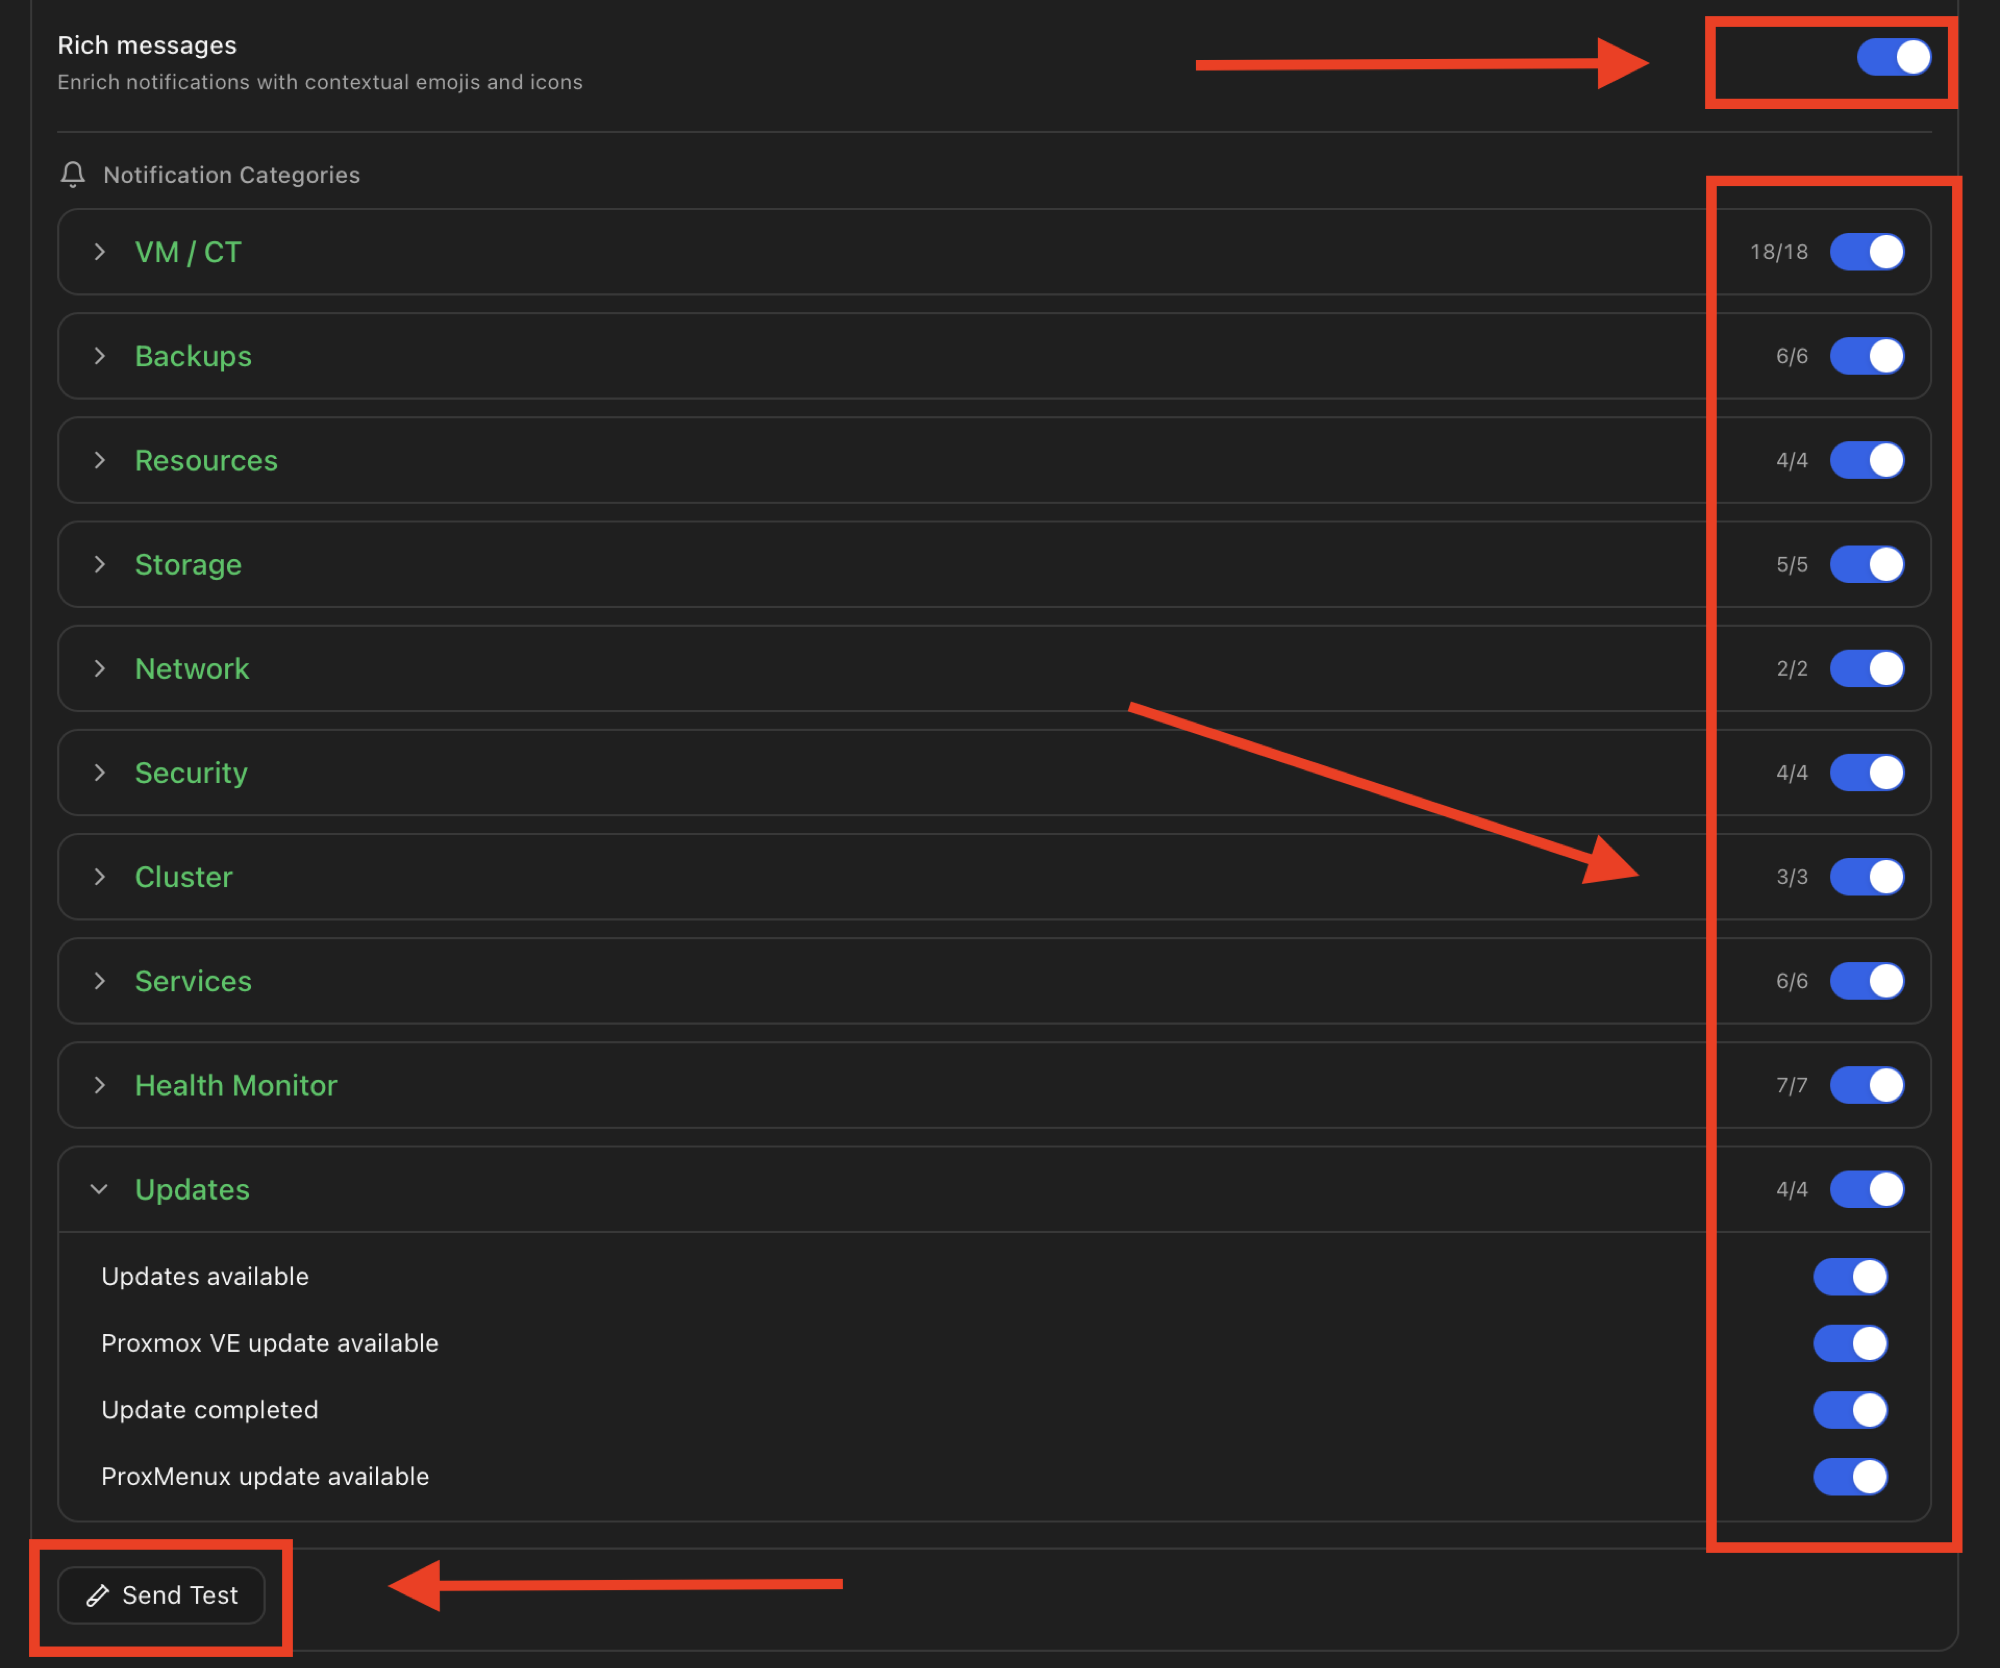
Below the channel form every channel exposes the same three controls: a Rich messages toggle at the top (highlighted with the arrow in the screenshot), eleven collapsible Notification Categories with per-event toggles, and a Send Test button at the bottom.
Rich messages
With Rich messages on, every event header is prefixed with a category emoji and the body is rendered using the channel's native formatting (Telegram HTML, Discord embed with severity colour). With it off, the Monitor sends a plain-text version with the same information minus the visual cues. Same content, different presentation:
[INFO] vm_start
VM 101 (homeassistant) started
on node pve-01
host: home-lab
🟢 VM started
VM 101 (homeassistant) is now
running on node pve-01
🏠 home-lab
The toggle is per-channel: leave Email plain for inbox-rule readability while letting Telegram and Discord render the rich version. Channels that don't support inline formatting (plain-text email, Gotify) ignore the formatting and fall back to text either way.
Per-event categories
Around seventy event types are grouped into eleven UI categories. Each event has a master toggle and a per-channel override — two layers that decide whether a given event reaches a given channel:
- Per-event master toggle. If
vm_startis off everywhere, no channel ever sees avm_start. Toggles persist asevent_toggles[event_type] = true | false. - Per-channel overrides. An event type can also be muted for a specific channel ("send
backup_completeto Discord but not to Telegram"). These live inchannel_overrides[channel_name][event_type]and only apply if the event passed the master toggle.
Each category header in the screenshot also shows the count of events currently enabled / total for that group, and a category-level toggle that flips every event inside it on or off in one click — the shortcut for muting a whole group (e.g. all info backups, all update-related events) without expanding the section.
Quiet Hours
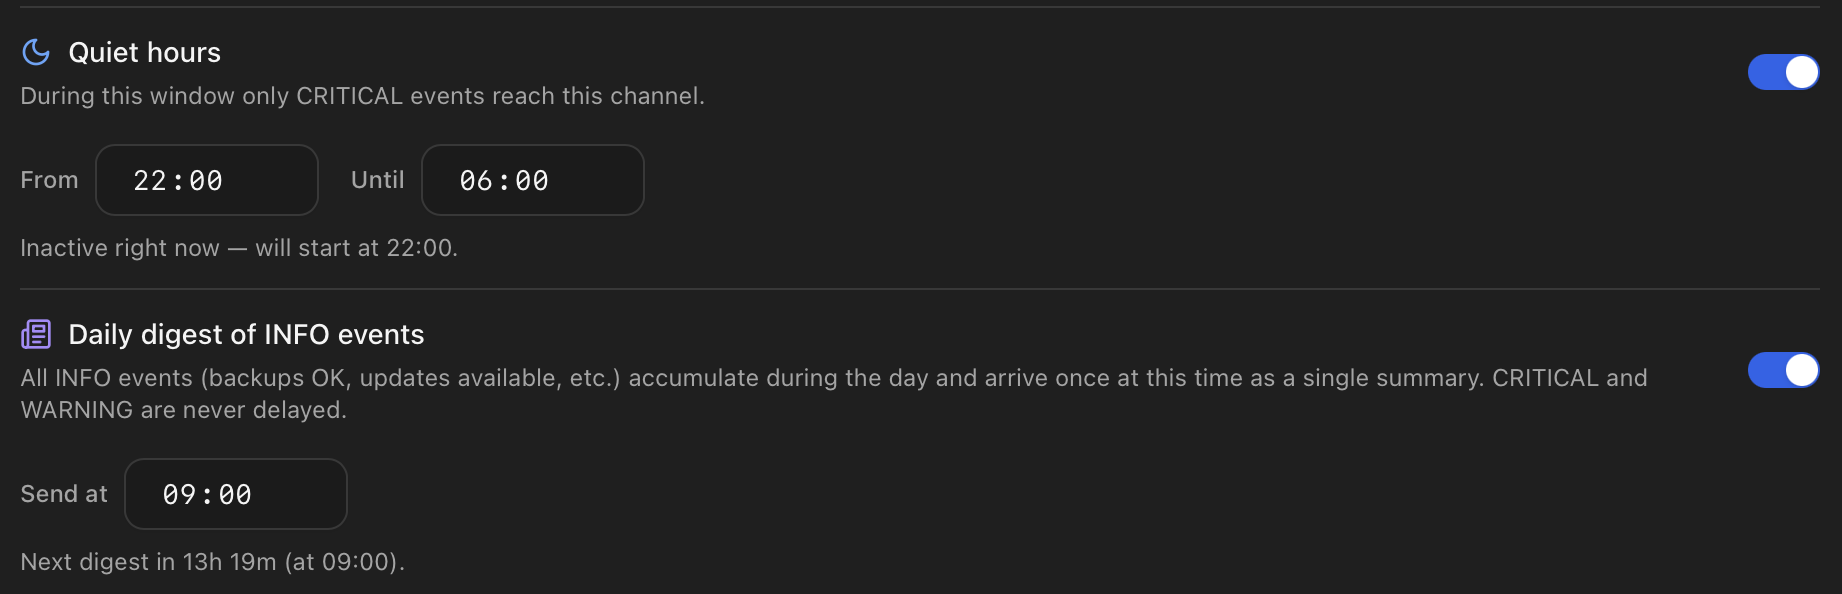
Quiet Hours is a per-channel time window during which the dispatcher only lets CRITICAL events through. Everything else — INFO, WARNING, action events — is held back, persisted to disk, and delivered as a single grouped summary the moment the window closes. The channel still gets the urgent things in real time; the noise waits until you're likely to want it.
What it is for
- Don't wake me at 03:00 for an update notice. Backups, app updates, post-install optimisations and other INFO-level events stop pinging your phone at night.
- But still wake me for a fire. Disk failures, OOM kills, host shutdowns, fail2ban bans — anything classified as CRITICAL — bypass the window and arrive immediately.
- Don't miss anything either. The events suppressed during the window aren't silently dropped — they sit in a SQLite buffer until you're back on the clock.
How it works
- Per-channel toggle. Each channel has its own Quiet Hours config — Telegram can be silent 22:00–07:00 while email keeps receiving everything 24/7.
- Start and end time in your local timezone, half-open interval (start inclusive, end exclusive). The window can cross midnight (e.g. 22:00–07:00 means tonight until tomorrow morning).
- Live preview line right below the inputs shows whether the window is currently active and when the next transition happens. Saves opening a clock.
- During the window: CRITICAL events still fire through the normal dispatch pipeline. INFO and WARNING events are routed to a persistent buffer (
quiet_pendingtable in the Monitor's SQLite DB). - When the window closes: a single grouped notification is sent with everything that accumulated — one line per buffered event, in chronological order. The buffer is cleared only after the channel confirms delivery, so a transient Telegram / SMTP outage doesn't lose the night's context.
- Across restarts. If the Monitor restarts mid-window, the buffer is intact on disk. If the restart happens just after the window closed, the next dispatch cycle detects the pending rows and flushes them with a single "recovery" summary — no notifications are lost to a deploy or a reboot.
What counts as CRITICAL
Daily digest of INFO events
The Daily Digest is the opposite knob: an opt-in setting that says "don't send me every successful backup or update notice as it happens — collect them and send me one summary per day at 09:00 (or whatever hour I choose)". Same goal as Quiet Hours (less noise) but a different mechanism (time-based summary instead of a daily window).
It lives in the same channel-settings card as Quiet Hours (see the figure under Quiet Hours), right underneath. You enable each one independently.
What it is for
- The morning "everything that happened" recap. If you check on the host once a day with a coffee, one digest at 09:00 carries the same information as 20 individual pings throughout the previous day, without you reading 20 Telegram bubbles.
- Separate noise from signal. INFO events answer "what happened"; CRITICAL and WARNING answer "what do I need to do right now". The digest handles the first; everything else keeps its live delivery.
How it works
- Per-channel opt-in. Off by default — Telegram doesn't silently batch your alerts. You enable it on the channels where you want a digest, leaving others on live delivery.
- Delivery time in your local timezone. Defaults to 09:00 but you can pick any time; the dispatcher fires the digest within ~60 s of that minute.
- What goes into the digest: any event the channel would have received live whose severity is INFO. Examples — vzdump complete, Tailscale update available, ProxMenux optimisation update available, APT security updates pending, rate-limit hit.
- What is never delayed:
- CRITICAL events always go through immediately.
- WARNING events always go through immediately.
- Live-action events (VM/CT start / stop / shutdown / restart, vm_fail / ct_fail, backup start / fail, replication start / fail, host shutdown / reboot) bypass the digest even at INFO severity — you opted in to see those live, the digest would defeat that opt-in.
- Persistence. Pending events sit in a SQLite table (
digest_pending) until the configured hour. The Monitor can restart freely without losing what the digest will eventually contain. - Empty days are silent. If nothing INFO-level happened, no digest is sent — the channel stays quiet rather than receiving a "no events to report" message.
Combining Quiet Hours and Daily Digest
Display Name
Every notification carries a Display Name — the label that identifies which host produced the alert. It is the value you see at the bottom of the rich-messages example above (🏠 home-lab) and inside the email subject prefix.
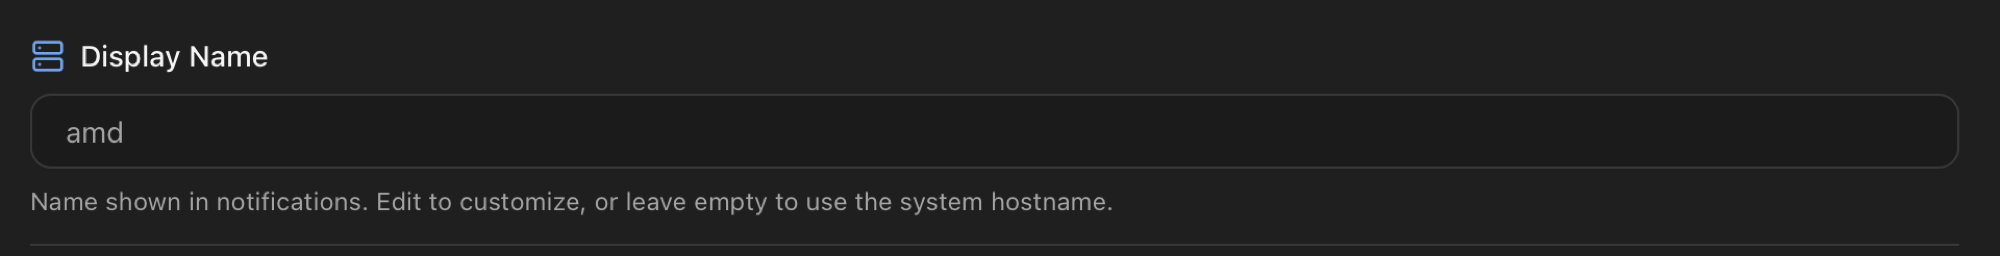
If the field is empty, the Monitor falls back to the system hostname. The override is mostly useful when you run several ProxMenux hosts that send to the same Telegram chat or inbox — a friendlier label (home-lab, office-pve) is easier to read than pve01.lan or pmx-prod-01.
Dispatch pipeline
Between an event being raised and a message leaving the host, three stages run in this order:
| Stage | What it does | Tunable? |
|---|---|---|
| 1. Fingerprint dedup | Each event is hashed into a fingerprint (event_type + key fields from data). Identical fingerprints inside a short window are considered duplicates of the first one. | No — internal dispatcher logic. |
| 2. Cooldown | After a fingerprint is sent, the same fingerprint is suppressed for the per-severity cooldown duration. Stored in the notification_last_sent SQLite table so it survives restarts. Defaults: CRITICAL 60 s, WARNING 300 s, INFO 900 s, plus a per-category override on top (e.g. resources 900 s, updates 86 400 s). | No — defaults baked into the dispatcher. |
| 3. Burst aggregation | When N events of a kind arrive inside a short window (e.g. an SSH brute-force flood), they are merged into a single burst_* message with a count and a sample. | No — window and threshold are hard-coded per event type. |
Dispatch happens in a background thread
Optional AI rewrite
Any event can be passed through an LLM that rewrites its body in plain language and (optionally) in the target user's language before fan-out. The AI rewriter is off by default. When enabled it runs in the dispatch thread; if the provider call fails or times out, the original templated body is used instead.
Six providers are supported (OpenAI, Anthropic, Google Gemini, Groq, OpenRouter and local Ollama), with per-channel detail level (brief, standard, detailed), output language, prompt mode (default or custom) and an optional custom prompt. Full configuration walk-through, captures and prompt examples live in the dedicated AI Assistant page.
Privacy note
PVE webhook integration
Proxmox VE 8.1+ has its own notification system with built-in endpoints (sendmail, gotify, SMTP, webhook). When you enable Notifications on the Monitor, it registers itself as one of those endpoints — a webhook target that points back at the Monitor's own API. From that moment on, anything Proxmox itself emits (HA fencing, replication, vzdump from the GUI, certificate renewal, etc.) flows through the same dispatch pipeline as the Monitor's own events.
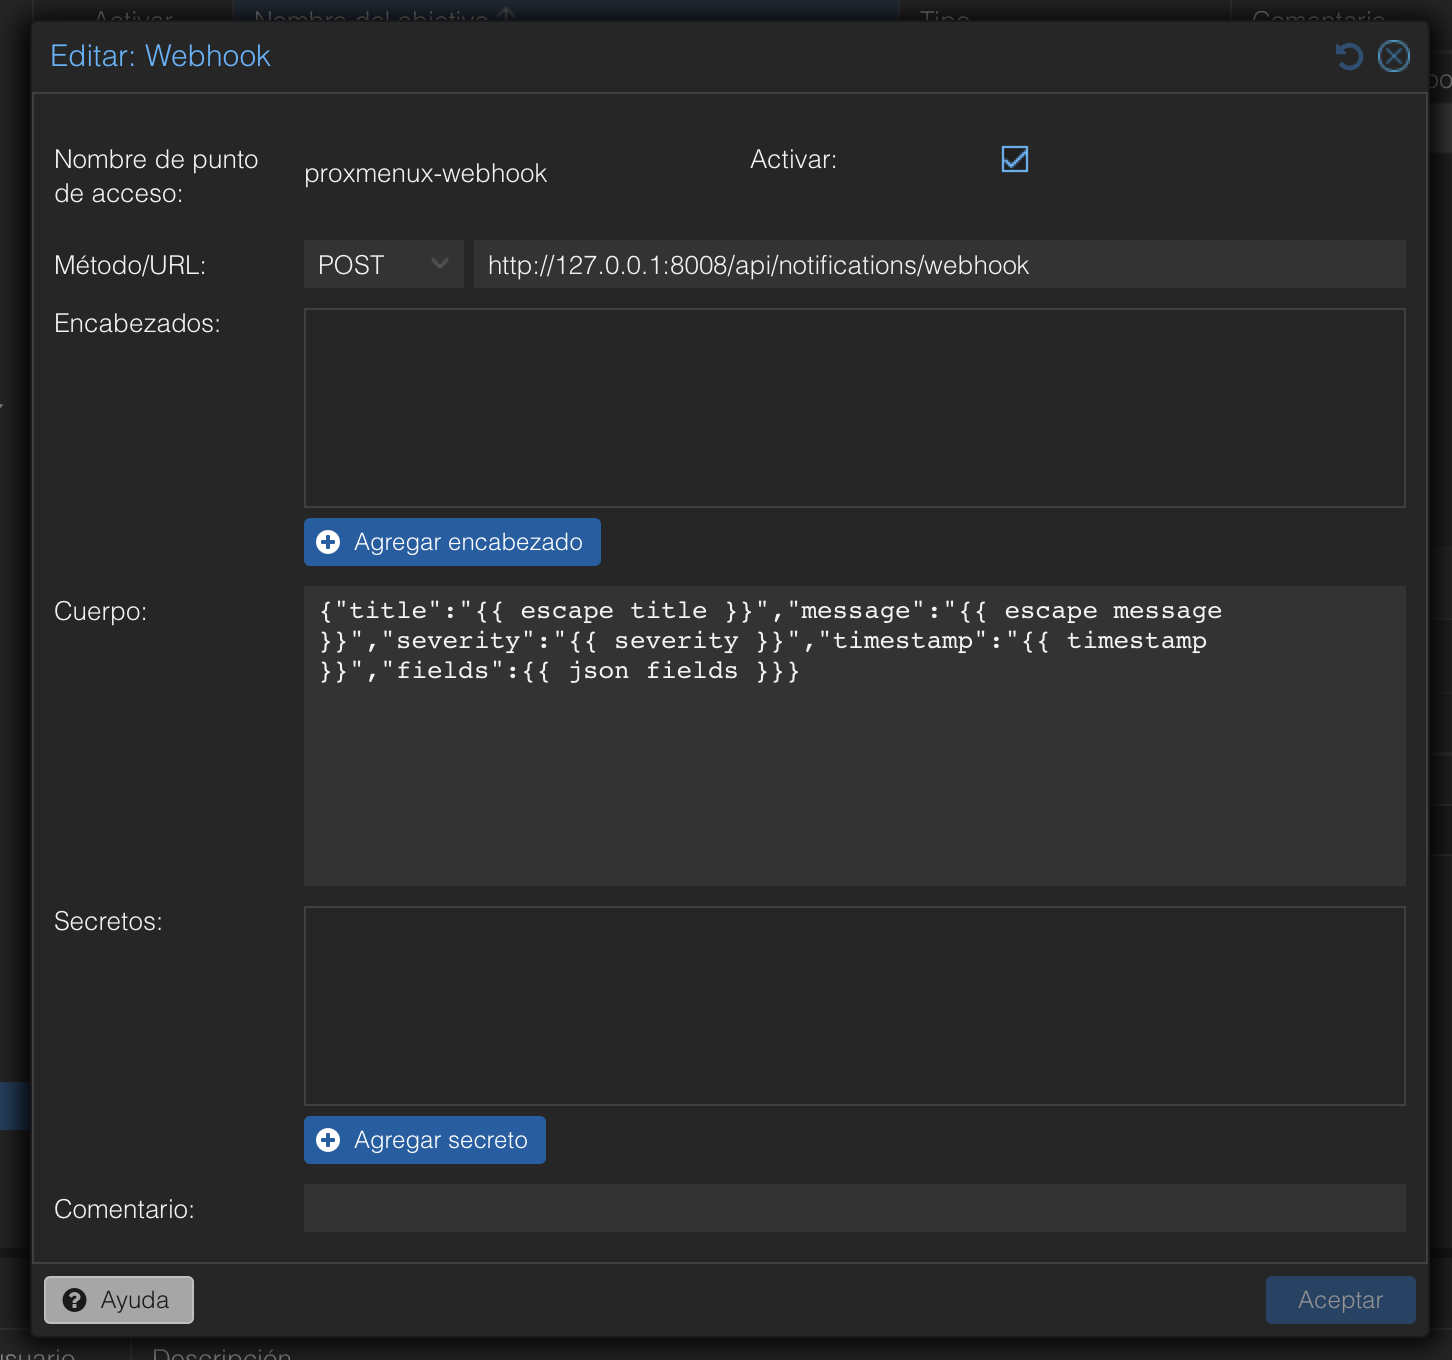
The target is visible from the Proxmox GUI at Datacenter → Notifications → Notification Targets:
What gets registered:
- Method & URL.
POST http://127.0.0.1:8008/api/notifications/webhook. Loopback only — PVE talks to the Monitor process running on the same host. - Body template. A JSON body using PVE's native Handlebars helpers — stored base64-encoded in the config file by PVE, but it expands to:
{ "title": "{{ escape title }}", "message": "{{ escape message }}", "severity": "{{ severity }}", "timestamp": "{{ timestamp }}", "fields": {{ json fields }} } - Matcher. A companion
matcher: proxmenux-matcherblock withmode allso every PVE notification reaches the target. - Companion priv block. An empty
webhook: proxmenux-webhookentry is appended to/etc/pve/priv/notifications.cfg. PVE refuses to instantiate any webhook endpoint without a matching private block, even when no secrets are needed — so the Monitor writes a header-only stub there. No tokens, headers or HMAC are configured on the PVE side.
How the receiver is secured
The webhook receiver at POST /api/notifications/webhook applies different security layers depending on where the request comes from:
- Loopback (
127.0.0.1/::1). Rate-limit only. The endpoint trusts the loopback interface — only processes running on the host can reach it, and PVE itself cannot send custom auth headers in the body it generates. This is the path every PVE-emitted notification travels. - Remote callers. Five layers stack on top of rate-limiting: a shared secret in the
X-Webhook-Secretheader, a freshness timestamp inX-ProxMenux-Timestamp(rejected if it drifts more than the configured window), a replay-cache lookup, and an optional IP allowlist. The shared secret lives in the Monitor's SQLite settings table — not in/etc/pve/priv/notifications.cfg— and is generated at first setup. This path exists for custom integrations posting from outside the host; the PVE-configured target never exercises it.
In practice
http://127.0.0.1:8008, so PVE-emitted notifications always go through the loopback path with rate-limit-only security. The remote-caller path with the shared secret is opt-in for custom integrations — point an external service at https://<monitor-host>:<port>/api/notifications/webhook and supply the X-Webhook-Secret header to use it.The Monitor manages this target through three actions on the Settings tab:
- Setup — runs automatically when you enable Notifications. Creates the entry in
/etc/pve/notifications.cfgafter backing up the current file. - Cleanup — removes the entry. The previous backup of the file is kept.
- Read config — shows the current targets and matchers as PVE sees them. This is how you confirm the Monitor's entry is the one firing when PVE has multiple notification routes configured.
Cluster nodes
/etc/pve/ is replicated across cluster members, so the webhook target is visible on every node. Each node, however, posts to its own 127.0.0.1:8008 — meaning the Monitor running on that node receives the events that PVE generated locally. Run the Monitor on every node you want to see in the Notifications history.Event catalogue
Around seventy event types are grouped into eleven UI categories. The Notifications panel renders one collapsible section per group with a toggle for every event inside it. Each event is on by default unless explicitly marked otherwise.
| Group | Events |
|---|---|
| VM / CT | vm_start, vm_start_warning, vm_stop, vm_shutdown, vm_fail, vm_restart, plus the ct_* equivalents, migration_start, migration_complete, migration_warning, migration_fail, replication_complete, replication_fail. |
| Backups | backup_start, backup_complete, backup_warning, backup_fail, snapshot_complete, snapshot_fail. |
| Resources | cpu_high, ram_high, temp_high, load_high. |
| Storage | disk_space_low, disk_io_error, storage_unavailable, smart_test_complete, smart_test_failed. |
| Network | network_down, network_latency. |
| Security | auth_fail, ip_block, firewall_issue, user_permission_change. |
| Cluster | split_brain, node_disconnect, node_reconnect. |
| Services | system_startup, system_shutdown, system_reboot, system_problem, service_fail, oom_kill, system_mail. |
| Health Monitor | new_error, error_resolved, error_escalated, health_degraded, health_persistent, health_issue_new, health_issue_resolved. |
| Updates | update_summary, update_available, pve_update, update_complete, proxmenux_update. |
| Hardware / GPU | gpu_mode_switch, gpu_passthrough_blocked, pci_passthrough_conflict, ai_model_migrated. |
A handful of burst_* aggregation types (burst_auth_fail, burst_ip_block, burst_disk_io, etc.) exist only in the dispatcher — they replace bursts of individual events with a single summary message and are not exposed as toggles in the UI. They inherit the on/off state of their parent event type.
History
Every dispatch attempt the dispatcher actually performs is recorded in the notification_history SQLite table. Each row stores the timestamp (sent_at), channel, event type, severity, title, rendered message body, a success flag and — when the send failed — the error returned by the provider in error_message. Burst-aggregated events appear as a single row with the burst_* event type. Events suppressed by the cooldown stage are not logged: they never become a dispatch attempt.
The History tab inside Settings → Notifications shows the last 20 entries and has a single Clear button that wipes the table.
The same data is exposed at GET /api/notifications/history with optional limit, offset, severity and channel query parameters, and can be cleared with DELETE /api/notifications/history.
API endpoints
| Endpoint | Method | Use |
|---|---|---|
| /api/notifications/settings | GET / POST | Read or write the full configuration (channels, per-event toggles, AI rewriter, Display Name). |
| /api/notifications/test | POST | Send a test notification to one channel: {"channel":"telegram"}. |
| /api/notifications/test-ai | POST | Render and rewrite a sample event without dispatching it. |
| /api/notifications/provider-models | POST | List available models for the selected AI provider. |
| /api/notifications/send | POST | Emit an event from outside (custom integrations). |
| /api/notifications/history | GET / DELETE | Read history with filters; clear it. |
| /api/notifications/webhook | POST | Receives Proxmox VE's own notifications. Loopback callers are rate-limited only; remote callers must additionally pass the X-Webhook-Secret header, X-ProxMenux-Timestamp freshness check, replay cache and optional IP allowlist. |
| /api/notifications/proxmox/setup-webhook | POST | Register the Monitor as a target in /etc/pve/notifications.cfg. |
| /api/notifications/proxmox/cleanup-webhook | POST | Remove the Monitor target from PVE's notification config. |
| /api/notifications/proxmox/read-cfg | GET | Show the current PVE notification config as PVE sees it. |
# Send a test notification to Discord
curl -X POST http://<host>:8008/api/notifications/test \
  -H "Authorization: Bearer <api-token>" \
  -H "Content-Type: application/json" \
  -d '{"channel":"discord"}'

# Emit a custom event from a script
curl -X POST http://<host>:8008/api/notifications/send \
  -H "Authorization: Bearer <api-token>" \
  -H "Content-Type: application/json" \
  -d '{"event_type":"custom","severity":"warning","data":{"message":"Cron job took >10 min"}}'

# Pull the last 50 history entries for one channel
curl -H "Authorization: Bearer <api-token>" \
  'http://<host>:8008/api/notifications/history?channel=telegram&limit=50' | jq

# Test an AI provider connection (verifies the API key and model)
curl -X POST http://<host>:8008/api/notifications/test-ai \
  -H "Authorization: Bearer <api-token>" \
  -H "Content-Type: application/json" \
  -d '{"provider":"openai","api_key":"sk-...","model":"gpt-4o-mini"}'
Where to next
- AI Assistant — providers, models, prompt modes, languages, per-channel detail levels.
- Health Monitor — the largest single producer of events, with its own per-category suppression durations.
- Architecture — where the SQLite tables (
notification_last_sent,notification_history) and the dispatch thread fit into the wider Monitor process. - Access & Authentication — how API tokens are minted for scripts that call
/api/notifications/send. - Dashboard → System Logs — the live view of the same journal that feeds the journal watcher.