Dashboard: System Logs tab
Three sub-tabs under one roof: the system journal (journalctl with filters), Proxmox task history, and the notification log. All three are searchable, filterable and downloadable as text bundles.
Read-only by design
journalctl --vacuum-time=<N> or logrotate.Top row: four counters
- Total Entries — number of log records inside the active filter window.
- Errors — count of severity ≤ 3 (
err/crit/alert/emerg). - Warnings — count of severity 4 (
warning). - Backups — count of vzdump / PBS task entries in the same window.
Three sub-tabs
Logs
The system journal, served by journalctl on the backend. Filters available in the toolbar:
- Severity — emerg / alert / crit / err / warning / notice / info / debug, or any combination.
- Time range — last 5 min / 15 min / 1 h / 6 h / 24 h / 7 d / custom.
- Free-text search — substring or regex (
journalctl --grep). - Unit filter — restrict to a specific systemd unit (
pveproxy.service,nginx.service, …).
Each row shows timestamp, severity badge, source unit and the message. Long messages collapse with a "show more" toggle. The Download action bundles the current filter into a single .txt file via GET /api/logs/download — useful when you want to share a slice of journal with someone.
Log Details modal
Clicking any row opens a Log Details modal with every structured field journald captured for that single entry — the same view you'd build by hand running journalctl --output=verbose on the host.
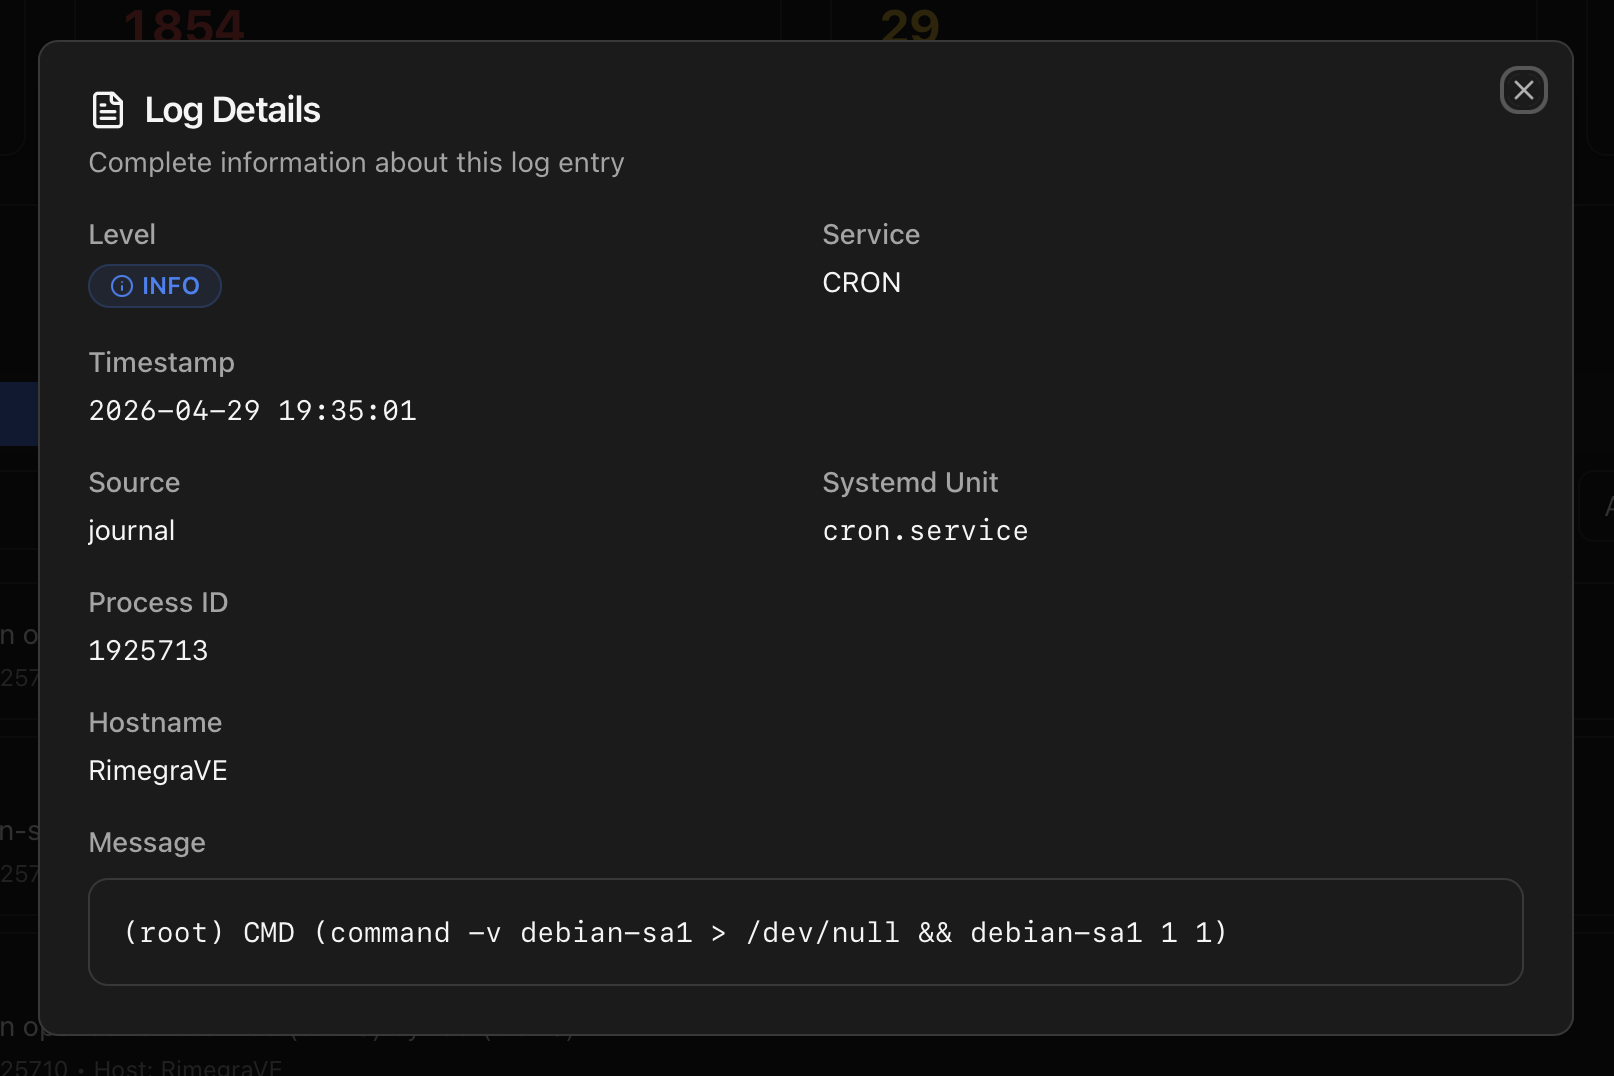
Fields shown:
- Level — coloured severity badge (INFO / WARNING / ERROR / CRITICAL).
- Service — short name of the unit / process that emitted the entry.
- Timestamp — full date and time of the log line.
- Source — origin of the entry (journal, kernel, audit, …).
- Systemd Unit — the actual
.service/.timer/.socketunit if the entry was associated with one. - Process ID — PID of the emitting process.
- Hostname — useful when journals are forwarded across cluster nodes.
- Message — the full untruncated message in a monospace block, ready to copy.
Journald MaxLevelStore
MaxLevelStore=warning, which silently drops info-level messages. The Monitor detects this on startup and adds a drop-in (/etc/systemd/journald.conf.d/proxmenux-loglevel.conf) raising the threshold to info so the Logs tab actually has something to show across all severities.Backups
Proxmox task history filtered to backup-related entries. One row per task (vzdump, PBS transfers, Garbage Collect, Verify) with the status (OK / WARNINGS / ERROR), guest involved, source storage, duration and the UPID. Click a row to load the full task log via GET /api/task-log/<upid> — the same data Proxmox exposes through Datacenter → Tasks, scoped to backups.
Notifications
Every notification dispatched by the Monitor — Telegram, Discord, Email, Gotify, ntfy, Slack, Teams, webhook. Each row: timestamp, channel, event type, severity, the rendered title, the rendered body, and (if AI is enabled) a toggle to view the AI rewrite next to the original.
Use this tab to verify a channel is actually delivering and to compare what the AI rewrite produced vs the template baseline. Channel configuration lives in the Notifications deep page.
How the data is collected
| Sub-tab | Endpoint | Source |
|---|---|---|
| Logs (live filter) | /api/logs | journalctl --output json --since <range> with severity / unit / search filters applied server-side. |
| Download | /api/logs/download | Same query, returned as plain text for grep / less. |
| Backups | /api/backups | PVE task history filtered by vzdump, PBS transfers, Garbage Collect, Verify. |
| Backup task drill-in | /api/task-log/<upid> | Plain-text full task log read from /var/log/pve/tasks/<index>/<upid>. |
| Notifications history | /api/notifications/history | SQLite notification_history table fed by the dispatch loop. |
Both the live filter and the downloads are also reachable via the API:
# Last hour of errors and worse, with a keyword
curl -H "Authorization: Bearer <token>" \
  "http://<host>:8008/api/logs?severity=error&since=1h&search=zfs"

# Download the full journal of the last 6 hours as plain text
curl -H "Authorization: Bearer <token>" \
  -o pmx-journal.txt \
  "http://<host>:8008/api/logs/download?since=6h"

# Look up the full output of a specific task by UPID
curl -H "Authorization: Bearer <token>" \
  "http://<host>:8008/api/task-log/<upid>"
Where to next
- Health Monitor — the System Logs category that watches for persistent / spike / cascade patterns.
- Notifications — the journal watcher reads the same source and turns matches into notifications.
- API Reference — the logs and task-log endpoints with their query parameters.
- Dashboard index — the other tabs.