Dashboard: Storage tab
The host's storage state in one screen — Proxmox pools (NFS / CIFS / LVM / ZFS / dir), ZFS pool health, internal SATA / NVMe disks with SMART, and external USB drives. Click any disk to open a drill-in with the full SMART attribute table and the per-disk observation history.
Backed by three sources
pvesm status; ZFS state from zpool status; physical disks from lsblk + smartctl (and nvme for NVMe-specific fields). The tab refreshes every ~60 seconds; the per-disk drill-in triggers a fresh SMART read on demand.Status colours and thresholds applied here
- Capacity (host disks, PVE storages, ZFS pools, LXC mounts) — Warning 85 %, Critical 95 %.
- Disk temperature — HDD 60/65 °C · SSD 70/75 °C · NVMe 80/85 °C · SAS 55/65 °C (warning / critical).
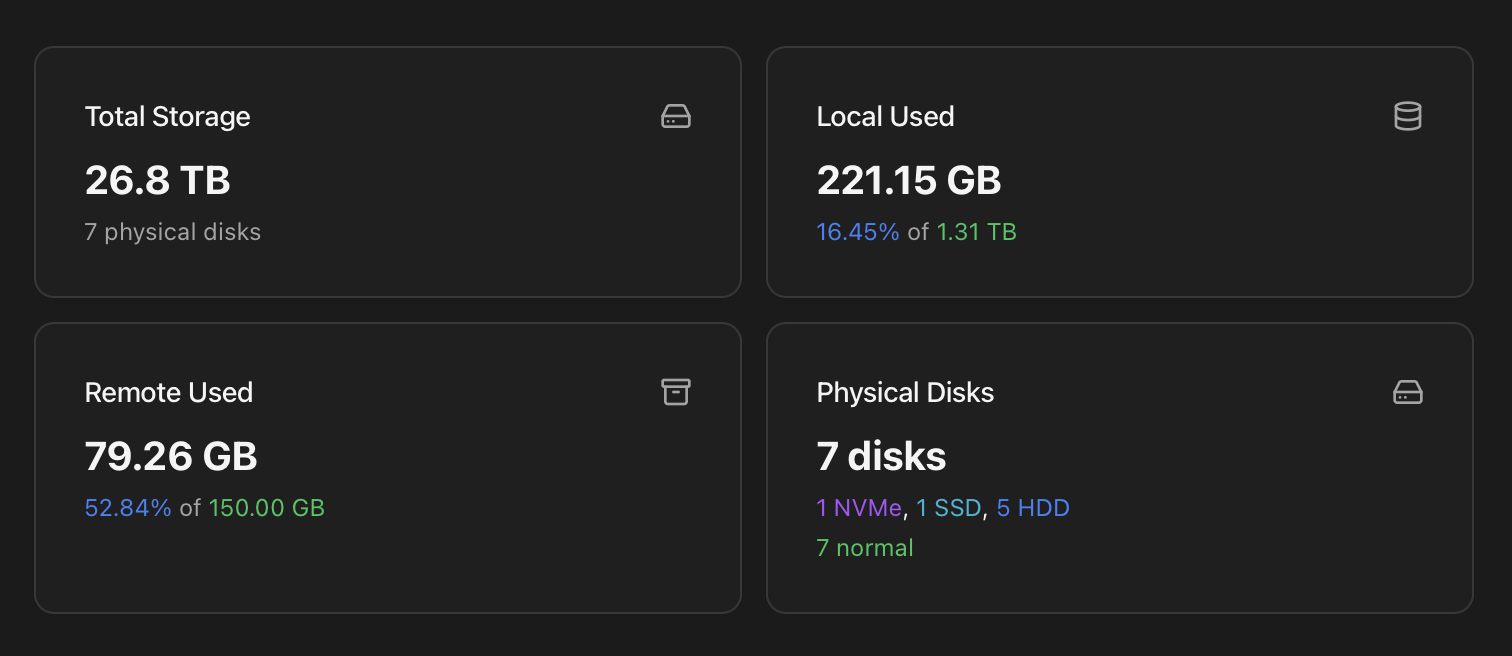
Top row: storage at-a-glance
Opening the Storage tab lands you on a four-card summary of the host's storage state — total capacity, what's used locally, what's used on remote storages, and the physical-disk inventory. Each card is a one-line answer to a common question; the cards below the row are where you drill into the detail.
| Card | What it shows |
|---|---|
| Total Storage | Combined raw capacity across every physical disk. Footer line shows the count of physical disks discovered. |
| Local Used | Bytes used on local storages (LVM / LVM-thin / ZFS / dir on the host's own disks). Shows the used bytes prominently, with a footer line of X.XX % of Y TB so you see the fill-percentage at the same time. |
| Remote Used | Same shape as Local Used but for remote storages (NFS / CIFS / PBS / Ceph / iSCSI). Counted separately because remote outages don't affect local data and you typically size and monitor them differently. |
| Physical Disks | Two lines of breakdown for the inventory:
|
Proxmox Storage card
One row per storage configured in /etc/pve/storage.cfg. Each row shows the type badge (nfs / cifs / zfspool / lvm / lvmthin / dir / pbs), the storage name, an active / error / not-monitored badge, the usage percentage and a coloured progress bar:
- < 75 % — blue progress bar, value in blue.
- 75 – 90 % — yellow progress bar, value in yellow (Health Monitor warns at this point).
- > 90 % — red progress bar, value in red (Health Monitor escalates).
- error — full row outlined in red, used when the storage is configured but unreachable (NFS server down, CIFS creds expired).
- excluded — purple outline + the badge "not monitored". Storages explicitly excluded by the user from health checks (handy for manual / archive volumes that are intentionally offline).
Excluding a noisy storage
excluded_storages table and respected by both the dashboard view and the Health Monitor cycle — no notifications fire for excluded storages, and they don't bump the header pill.ZFS Pools card
Renders only when ZFS is installed and at least one pool exists. One row per pool with a health badge, size / allocated / free, and an icon mirroring the health state:
- ONLINE — green. Everything healthy.
- DEGRADED — yellow. Pool is serving data but at least one device is unavailable; replacement window starts.
- FAULTED / UNAVAIL / SUSPENDED — red. Pool not serving data; immediate intervention required.
Both ZFS state and the per-disk SMART status feed the Disks & I/O category of the Health Monitor.
Physical Disks & SMART Status
Internal disks (SATA / NVMe). Each row condenses the most useful fields at a glance:
- Device path —
/dev/sda,/dev/nvme0n1. - Type badge — SATA / NVMe (and the relevant icon).
- System badge — orange tag that marks disks the host's OS is running from. The dashboard derives this from the mountpoints of
/and/boot: any physical disk hosting them gets the System tag so you don't accidentally wipe or repurpose it. Disks without the tag are pure data drives. - Model — vendor + model string from
smartctl -i. - Capacity — formatted human-readable.
- Temperature — current °C, coloured by the disk-type threshold (NVMe runs warmer than SATA).
- SMART status — passed / failed / unknown.
- Observations badge — when the permanent
disk_observationshistory has un-dismissed entries for this disk, a blue badge with the count appears (e.g. 3 obs.). Click the disk to drill in and review them. - Health badge — Healthy / Warning / Critical, derived from the SMART check + recent observations.
The whole row is clickable and opens the per-disk drill-in described below.
Don't touch System-tagged disks lightly
External Storage (USB)
A separate card for USB-attached drives, only renders when at least one is present. Same fields as internal disks plus an orange USB tag. USB drives often appear and disappear (cold backups, occasional offload jobs), so the Health Monitor is conservative about them — observations are retained, but I/O errors on a disconnected USB drive don't escalate.
Disk drill-in modal
Clicking any disk row opens a four-tab modal: Overview · SMART · History · Schedule. The header always shows the device path, the model + capacity and the orange System badge if applicable.
Tab 1 — Overview
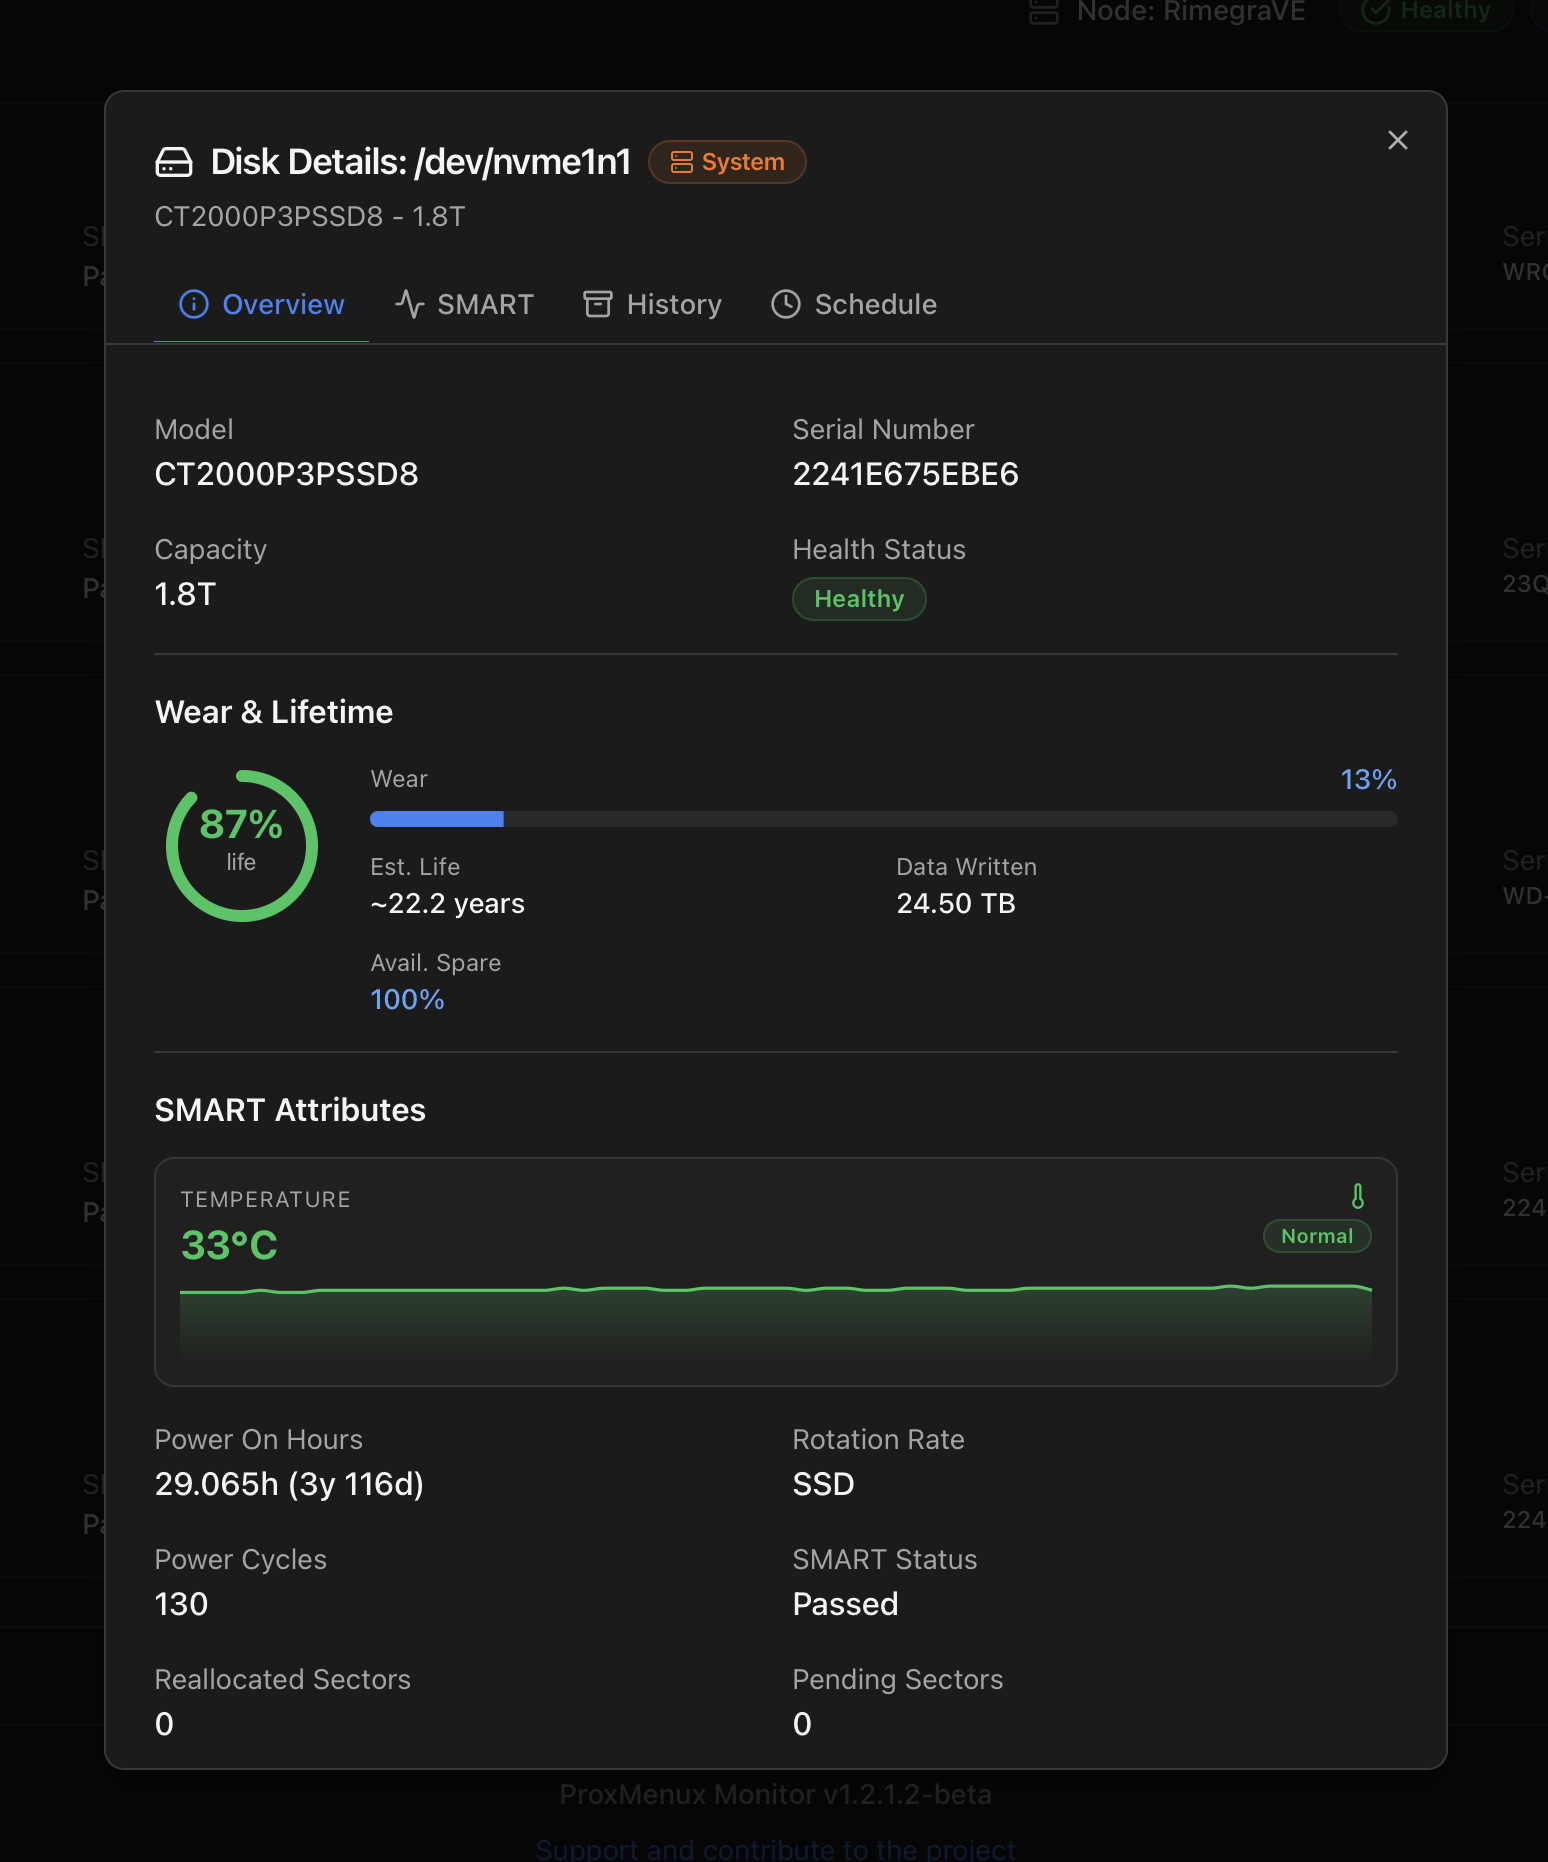
The default landing tab — everything you need to answer "is this disk OK?" without running a test. Three blocks:
- Identity — model, serial, capacity, Health badge (Healthy / Warning / Critical).
- Wear & Lifetime — large life-remaining ring (97 %, 50 %, …) with the source attribute spelled out (Media Wearout Indicator, Percentage Used, …), a wear bar (current consumption %), an Est. Life projection in years and the total Data Written. NVMe drives also show Available Spare.
- SMART Attributes — six headline fields on a 2-column grid: Temperature, Power On Hours (with humanised duration like 3y 116d), Rotation Rate (or SSD), Power Cycles, SMART Status, Reallocated Sectors, Pending Sectors, CRC Errors. The full attribute table lives in the SMART tab.
Tab 2 — SMART
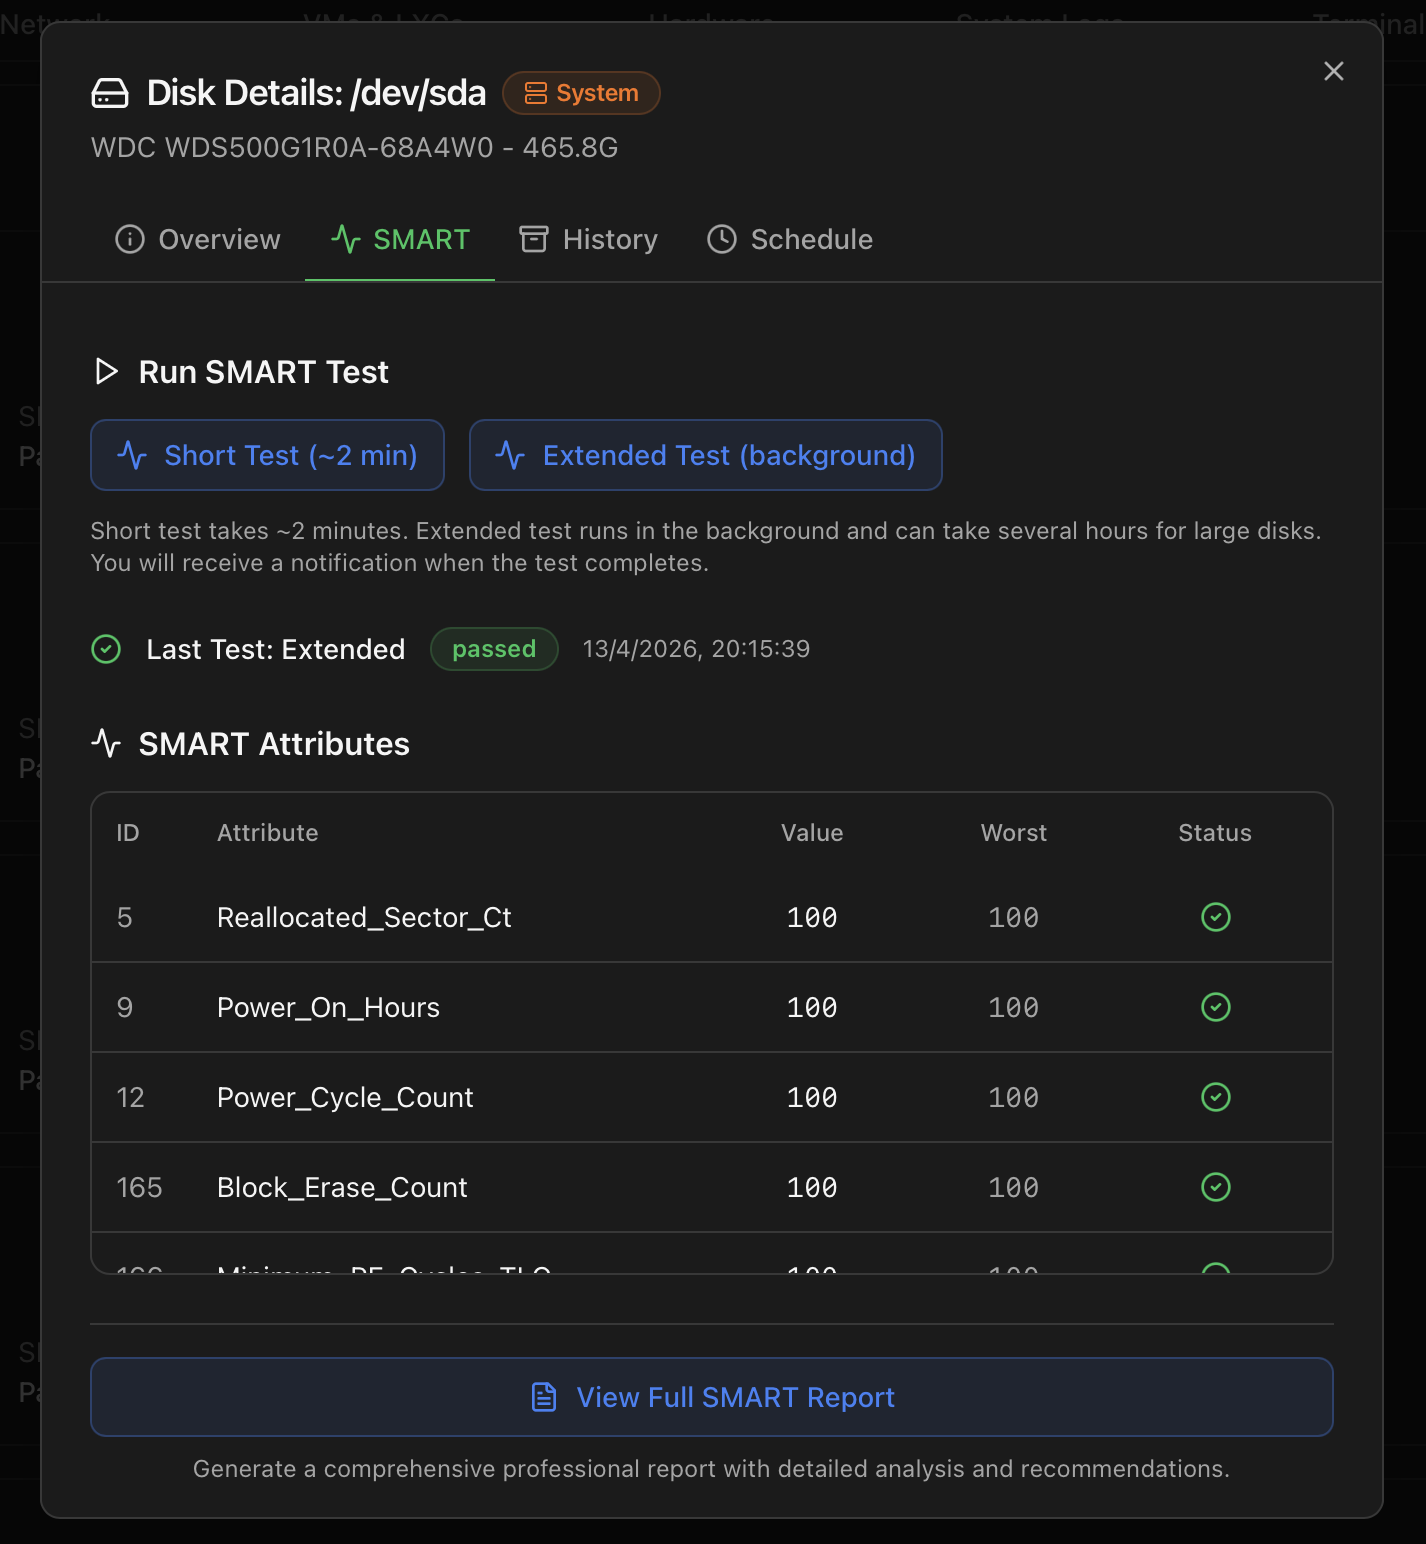
Where the actions live. Three sections:
- Run SMART Test — two buttons. Short Test (~2 min) runs synchronously and shows the result inline. Extended Test (background) can take hours on big drives, runs server-side and fires a notification when it completes.
- Last Test — type, status badge (passed / failed) and timestamp of the most recent run.
- SMART Attributes — the full attribute table (ID / name / value / worst / status with OK / warning / critical icons). For SATA / SAS, the classical numbered list. For NVMe, the structured fields from
nvme smart-log(temperature, available spare, percentage used, data units written / read, host reads / writes, controller busy time, power cycles, unsafe shutdowns, media errors, error-log entries, warning / critical composite temperature time).
View Full SMART Report (PDF)
At the bottom of the SMART tab, the View Full SMART Report button generates a printable, archive-ready PDF — the same structured report you'd send to a vendor for an RMA.
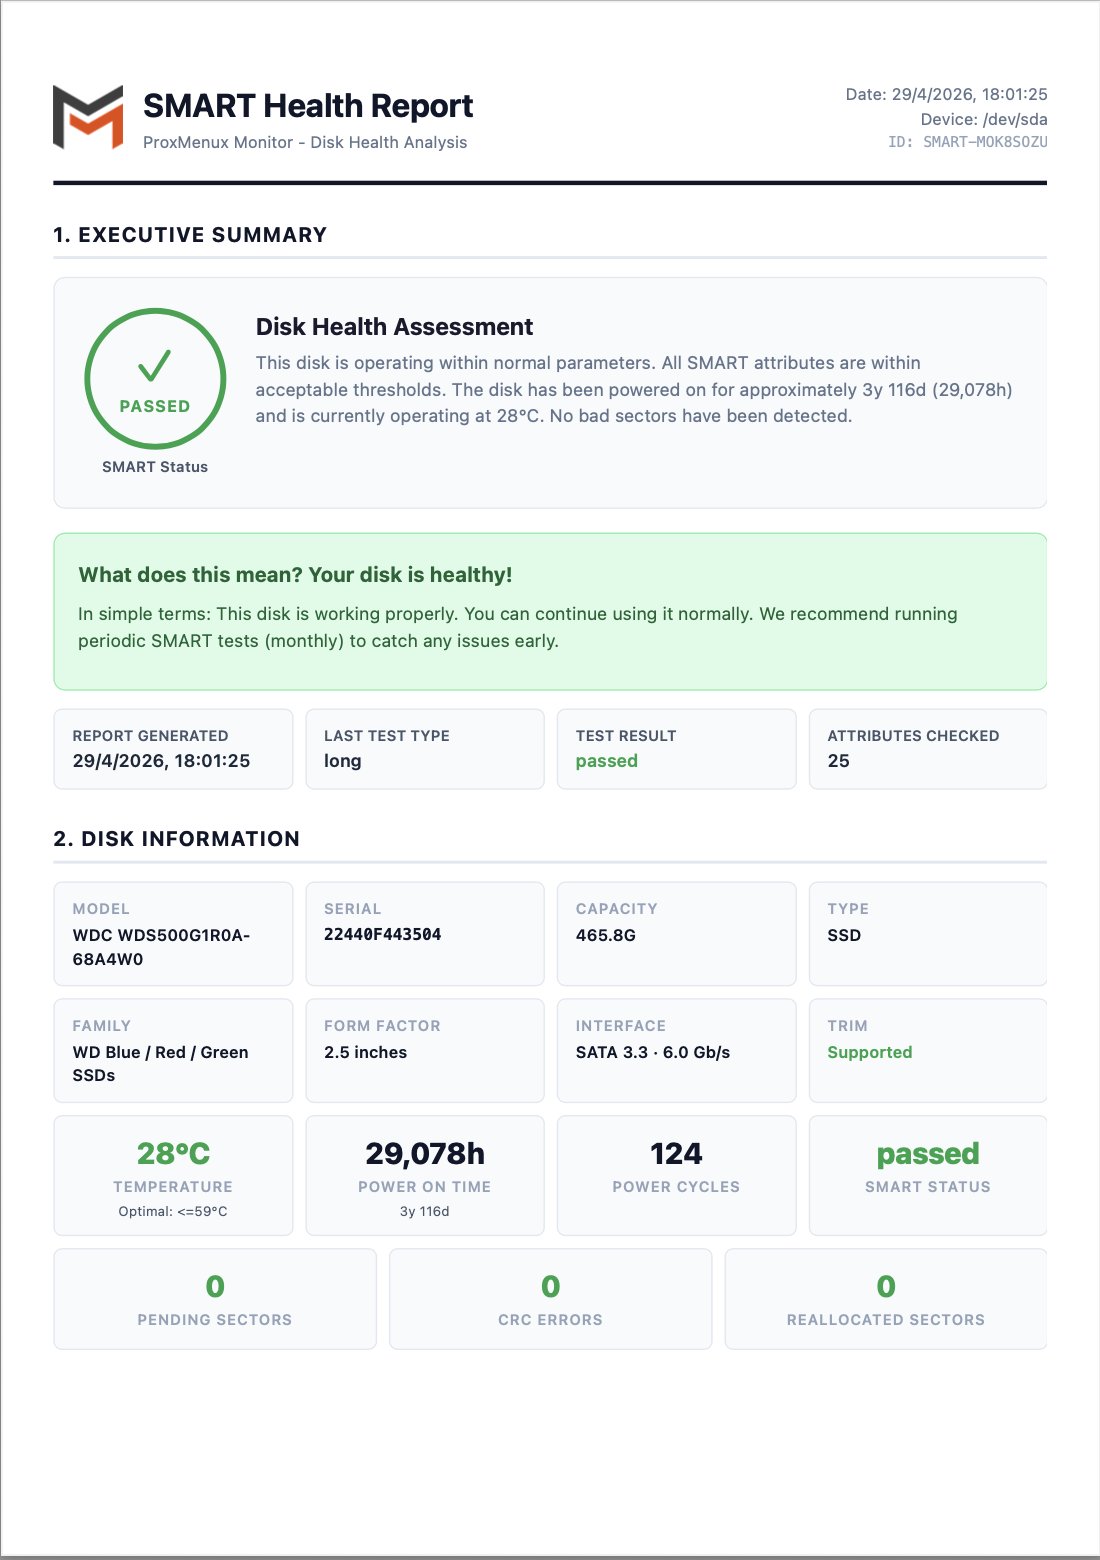
The report has five top-level sections:
- Executive Summary — large PASSED / FAILED verdict, plain-language disk health assessment paragraph ("your disk is healthy / showing signs of wear / failing"), and four quick stats (report timestamp, last-test type, test result, attributes checked).
- Disk Information — model, serial, capacity, type (HDD / SSD / NVMe), family, form factor, interface (SATA 3.3 · 6.0 Gb/s, …), TRIM support, current temperature with the optimal threshold, power-on time, power cycles, SMART status, plus the headline counters (pending sectors, CRC errors, reallocated sectors).
- SSD Wear & Lifetime (SSD / NVMe only) — life-remaining ring, source attribute, current wear level, data written, power-on hours.
- SMART Attributes (full) — every attribute the drive reports, with ID, name, value, worst, threshold, raw value and a status pill. The most user-relevant ones (Reallocated Sector Ct, Power On Hours, Reported Uncorrect, UDMA CRC Error Count, Media Wearout Indicator, …) include a one-line plain-language explanation under the row.
- Last Self-Test Result + Full Self-Test History — the latest test (type, result, completion message, at which power-on-hours mark) plus a numbered table of every retained test.
- Recommendations — action items based on the verdict: Disk is Healthy / Schedule periodic tests / Backup strategy for healthy drives, escalating language with replacement guidance when attributes are out of range.
The PDF is produced server-side and downloaded with a stable filename pattern (SMART-<short-id>.pdf) so multiple snapshots over time can sit side-by-side in your archive. Useful when you're tracking degradation across months or sending evidence to vendor support.
Tab 3 — History
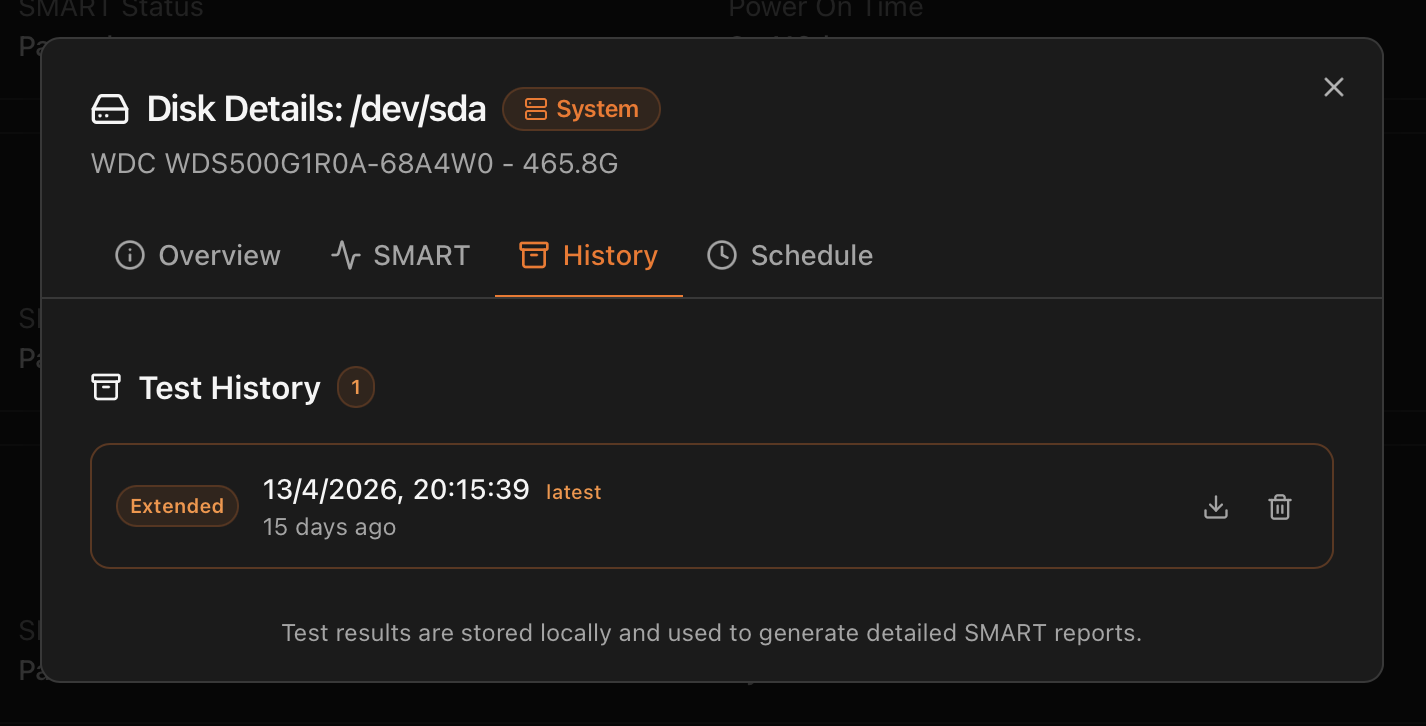
smartctl output) and delete actions.The retained pool of SMART tests for this disk — both short and extended runs that completed. Each entry is the raw smartctl output captured at run time, plus the structured fields the Monitor parsed out for the dashboard. Per-row actions:
- Download — saves the raw
smartctl -aoutput as a text file. Identical to what the PDF report parses, useful when you need the exact line a vendor asks for. - Delete — removes the test from history. The retention limit set in the Schedule tab (Last 5 / 10 / 20) deletes oldest-first automatically; this action is the manual override.
Tab 4 — Schedule
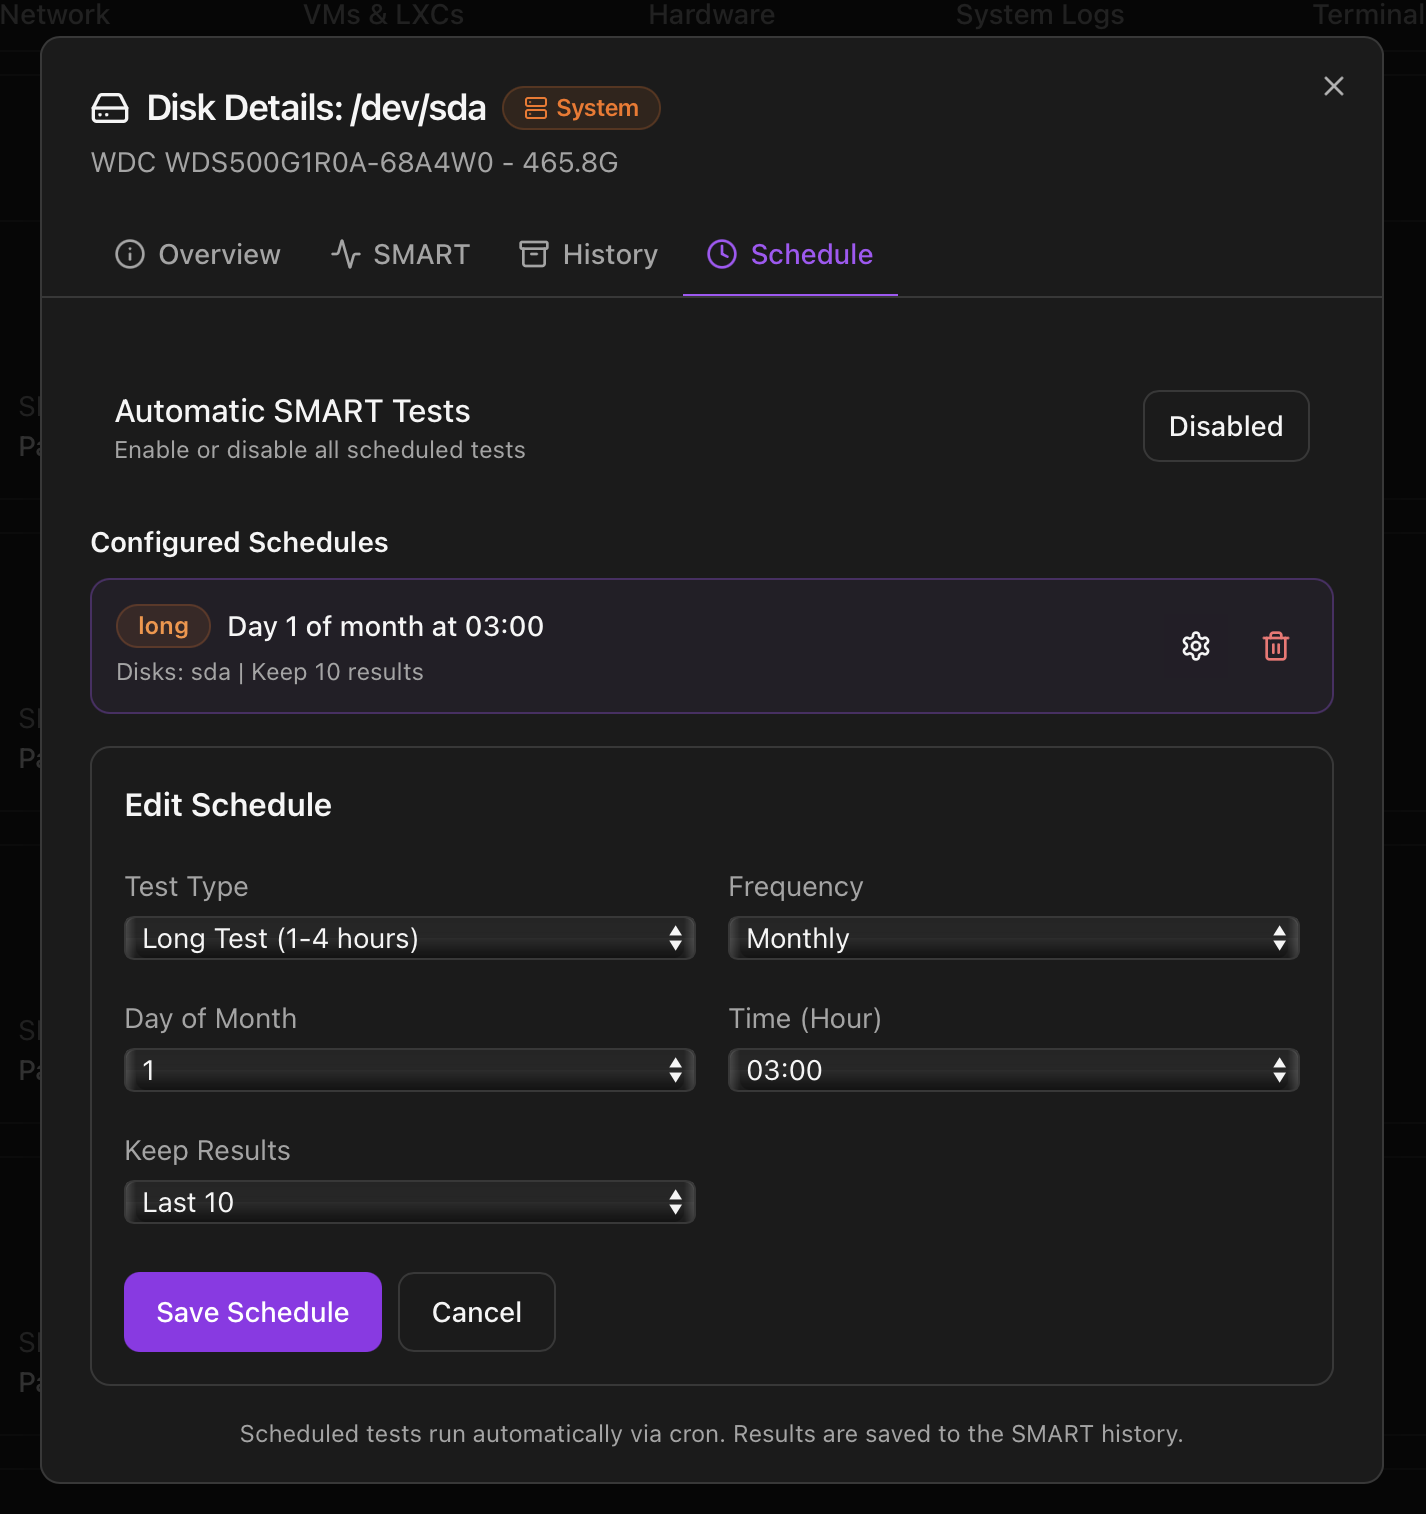
cron so tests run unattended.Cron-driven automatic SMART tests, no shell needed. The page has three areas:
- Automatic SMART Tests toggle — global on/off switch for every schedule on this disk. Useful when you want to pause everything during maintenance without losing the schedule definitions.
- Configured Schedules — one row per existing schedule with the test type badge (short / long), the cron expression in human form ("Day 1 of month at 03:00", "Every Sunday at 02:00"), the disks it covers and the retention setting.
- Add Schedule / Edit Schedule — form with: Test Type (Short ~2 min / Long 1-4 h), Frequency (Daily / Weekly / Monthly), Day of Month / Day of Week, Time, Keep Results (Last 5 / 10 / 20).
The schedule is materialised as a cron entry on the host that calls back into the Monitor; results are saved to the same SMART history shown in Tab 3, and the retention setting auto-prunes the oldest test when a new one finishes.
Temperature history modal
Every disk that exposes a temperature sensor has its readings sampled continuously by the Monitor and persisted to a local time-series. The current value appears as one of the six headline SMART attributes in the Overview tab; clicking that block opens a dedicated temperature-history modal with the full picture.
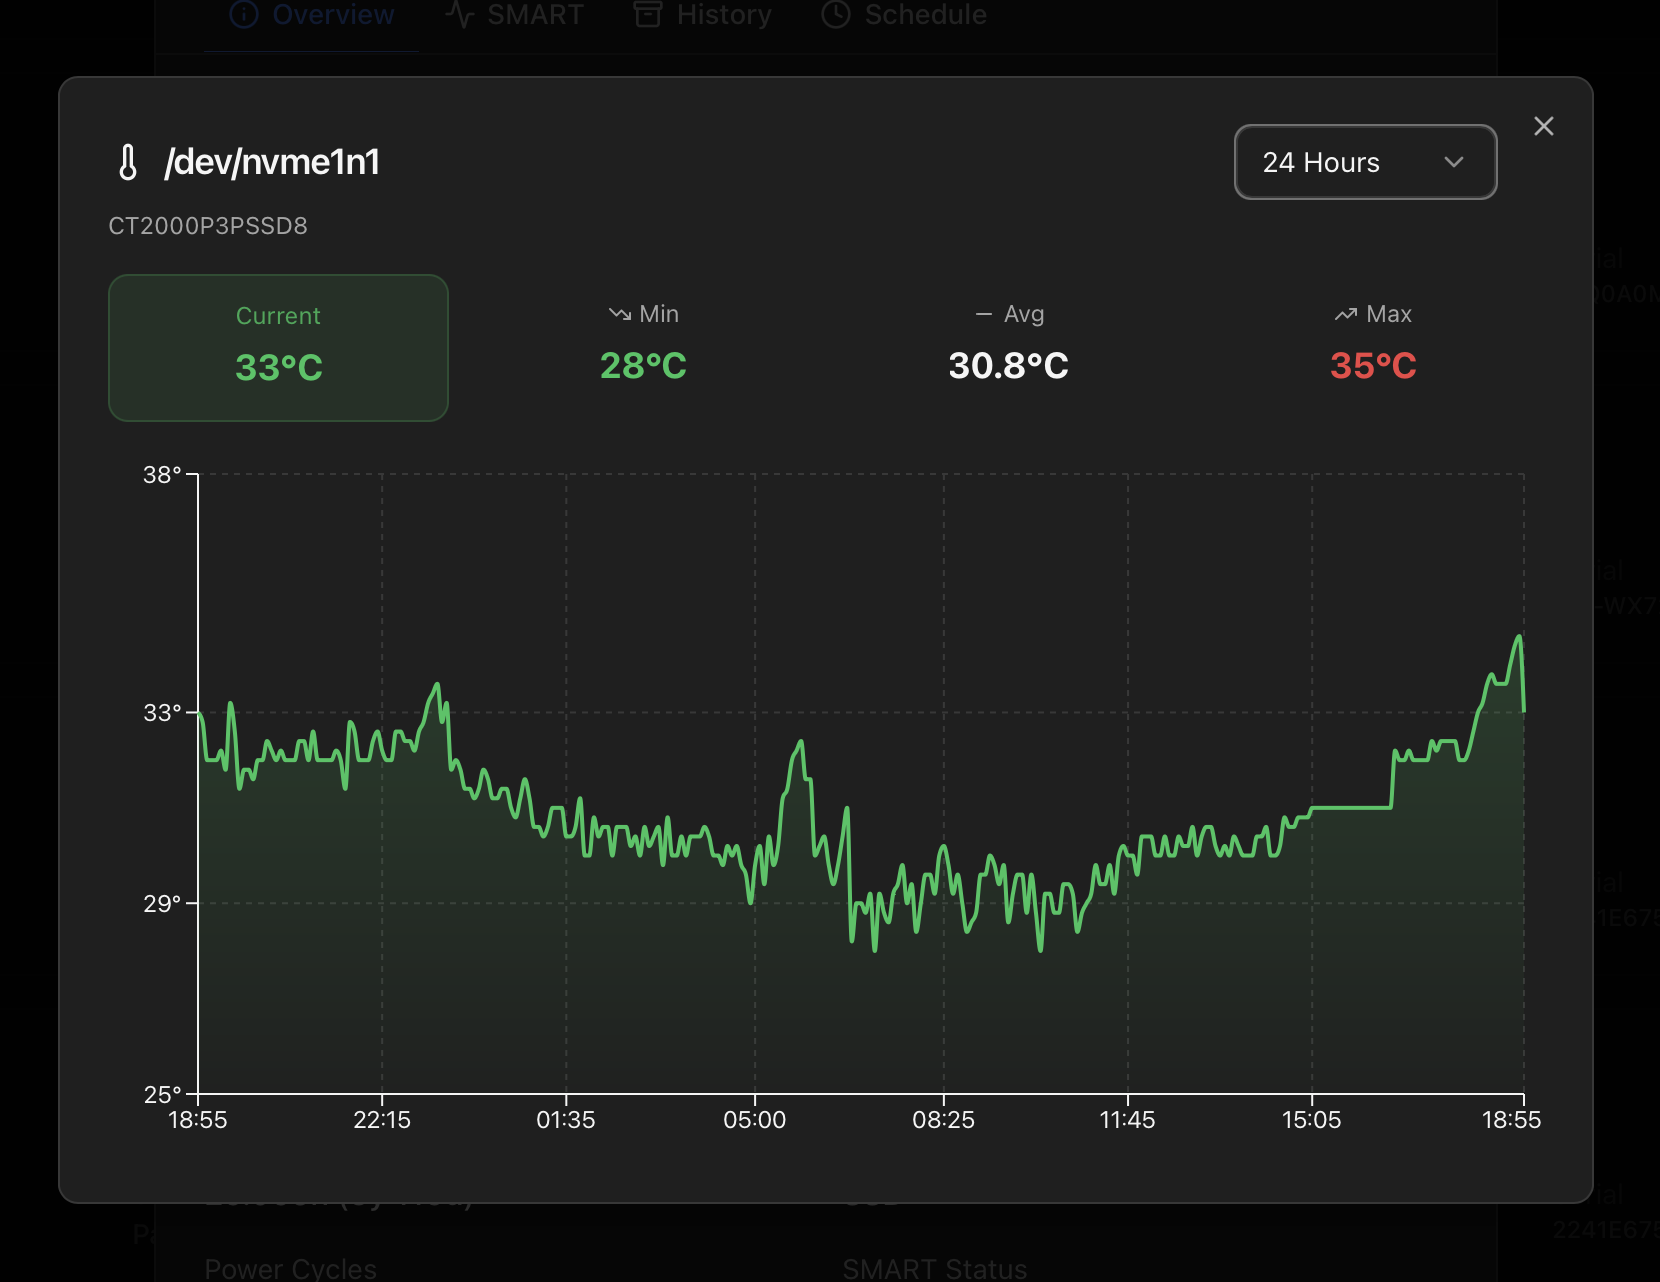
What the modal shows
- Timeframe selector with four ranges: 1 Hour, 24 Hours (default), 7 Days, 30 Days. Each one queries the same backend with a different downsampling so the chart stays readable at every horizon.
- Four stat cards at the top of the modal: Current, Min, Avg, Max for the selected range. The Current card is coloured by the same status thresholds the Storage tab and the notifications use, so you can see at a glance whether the disk is in normal / warm / hot territory.
- Line chart of the temperature over time, with the line and shaded area coloured by disk type:
- HDD — typically cooler thresholds.
- SSD — moderate thresholds.
- NVMe — higher thresholds (NVMe runs hotter by design).
- SAS — same defaults as HDD.
All four are configurable from Settings → Health Monitor Thresholds.
Why a history matters here
- Drift detection. Disks that progressively heat up over weeks (failing fan, dust build-up, neighbour disk dying and pushing hot air across) are invisible to a single "current temperature" readout. The 7-day and 30-day views surface the drift.
- Spike correlation. When a backup window or a rebuild pushed the disk briefly over its threshold, the 1-hour and 24-hour ranges show whether it was a one-off or a recurring pattern.
- Threshold tuning. Before raising or lowering a threshold in Settings → Health Monitor Thresholds, the 30-day chart shows the disk's actual operating range so the new value lines up with what the hardware really does rather than a guess.
Observation history (across tabs)
Modern disks fail gradually. A disk can report SMART PASSED and still log occasional read errors in dmesg, drop SATA links, or expose pending sectors that come and go. The standard Proxmox UI shows you the current SMART verdict — it does not keep a history of those signals. ProxMenux does, and surfaces them right inside the disk modal.
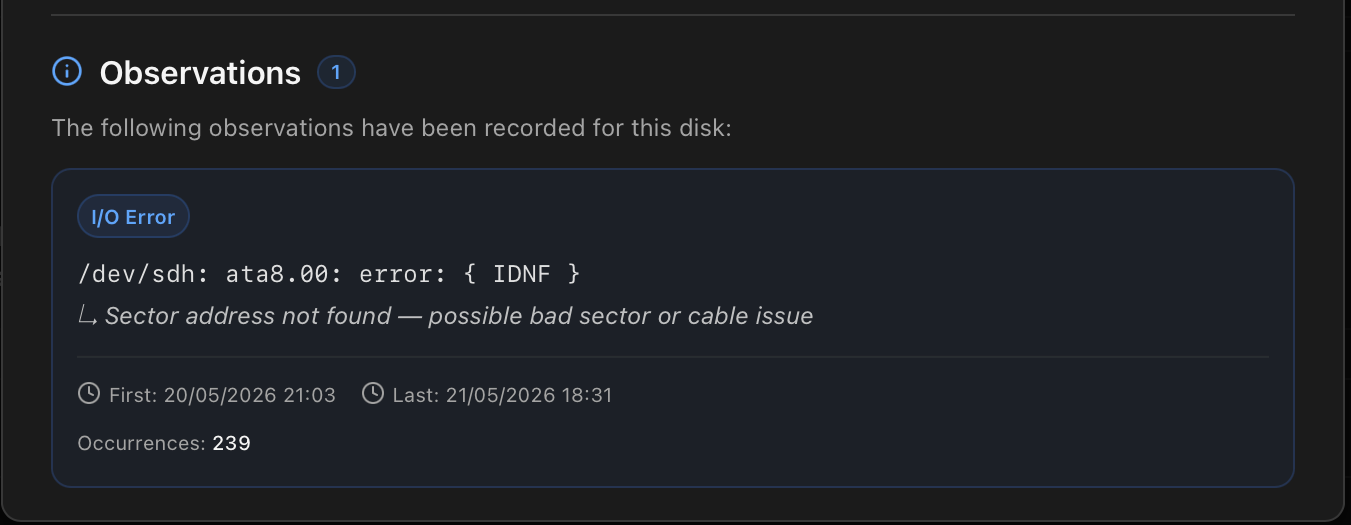
What an observation is
Anything ProxMenux catches in the kernel log, dmesg or SMART output that looks like a disk-level event — and that on its own would be too granular for a notification — is recorded as an observation. Each row shows:
- Type badge (I/O Error, SMART Error, Filesystem Error, ZFS Pool Error, Connection Error).
- Raw kernel message as it appeared in dmesg — useful when copy-pasting into a search engine or a support ticket.
- A human one-liner under the raw message for known ATA codes (
IDNF→ "Sector address not found — possible bad sector or cable issue",UNC→ "Uncorrectable read error — bad sector", and the rest of the standard codes). - First and last occurrence timestamps, plus an occurrence count deduplicated by error signature.
Why ProxMenux records and shows them
- Disk failure is rarely a single event. It usually starts with sporadic ATA bus errors, the odd UNC sector, or a couple of medium errors weeks before SMART flips to FAILED. Without persistence those early warnings disappear from dmesg on the next boot.
- SMART can lie. A drive can show all attributes green and still be on the way out — the observation layer catches the symptoms SMART doesn't expose (especially ICRC, IDNF, link resets at lower SATA speeds).
- It separates "is happening now" from "happened recently". The Health Monitor auto-resolves transient errors as soon as they stop firing, which is great for keeping the active alert list clean — but you still want to see, days later, that this disk had three I/O errors that night. The observation table is the answer.
- It feeds the tiered notification model. The disk_io detector reads observation rate from this table to decide silent / WARNING / CRITICAL (the sliding 24h window introduced in 1.2.1.2). The history is what makes that classification possible.
How dedup and re-notification work
Observations are deduplicated by their signature — a stable fingerprint of the error type, device and key fields of the kernel line. The same event repeating bumps the occurrence_count on the existing row rather than creating a new one. A different signature on the same disk creates a new observation and is treated as a new event for notification purposes.
Notifications follow an anti-cascade rule: the first occurrence of a given (disk, signature, severity) combination pages the operator, and ProxMenux then waits 24 hours before pinging again about the same combination — even if the count keeps climbing. Escalating severity (WARNING → CRITICAL) breaks the cooldown so the operator is told when things get worse, not just when they happen.
Dismissing vs resolving
Each row has a dismiss action. Dismissing an observation tells ProxMenux "I've seen this, stop notifying me about it". It does not freeze the occurrence counter — if the same fault keeps happening the count keeps climbing in the background, ready to alert again if it ever escalates to a different severity tier or signature. A dismissed observation stays visible on the card with a muted style, so a future operator can still see "this disk had history here".
Resolving on the active-error side (Health Monitor) is independent of observation dismiss — the observation persists past the active error's auto-resolve. That's the whole point: it survives, so a transient warning from last week is still visible on the disk card today. See Health Monitor for the active-error side of the same picture.
How the data is collected
| Section of the tab | Endpoint | Source |
|---|---|---|
| Top summary cards | /api/storage/summary | Aggregated from lsblk, zpool list, vgs / lvs. |
| Per-disk inventory | /api/storage | lsblk -O + smartctl -i per device, with stable disk identity cache (cleared on hot-plug events). |
| Proxmox storages | /api/proxmox-storage | pvesh get /nodes/<node>/storage with the active/online state of each. |
| SMART current values | /api/storage/smart/<disk> | smartctl -A <dev> — refreshed on demand, not cached. |
| SMART self-test history | /api/storage/smart/<disk>/history | Stored under /var/lib/proxmenux-monitor/smart/<disk>/ as JSON snapshots. |
| Permanent observations | /api/storage/observations | SQLite table fed by the Health Monitor every cycle (kept across auto-resolve). |
Verifying the collection chain on the host:
# Pull the current snapshot from a script
curl -H "Authorization: Bearer <api-token>" \
  http://<host>:8008/api/storage | jq '.disks[] | {name,model,smart_status}'

# Cross-check what the dashboard sees against the raw OS view
lsblk -O
zpool status
journalctl -t smartd --since '1 day ago' | tail
Where to next
- Health Monitor — the disks-and-I/O category and the suppression model.
- API Reference — the storage and SMART endpoints.
- Notifications — what
disk_io_error,storage_unavailableandsmart_test_failedtrigger downstream. - Dashboard index — the other tabs.
- ProxMenux → Disk Manager — the actions side: format / wipe / SMART tests / import disks into VMs and CTs from the TUI.
- ProxMenux → SMART Disk Health & Test — the CLI counterpart of this tab: schedule SMART tests, export the JSON the dashboard renders, and the deeper test-type / interpretation reference.