Dashboard: VMs & LXCs tab
The full inventory of guests on the node. Four headline metrics across the top, a sortable list of every VM and LXC below, and a drill-in per guest with config, resources, backups, logs and the four lifecycle controls (Start / Shutdown / Reboot / Stop).
The control surface for guests
POST /api/vms/<vmid>/control with an explicit confirmation and the response is reflected back in the guest's row. There is no force-shutdown without going through the dedicated Stop button.Top row: four stat cards
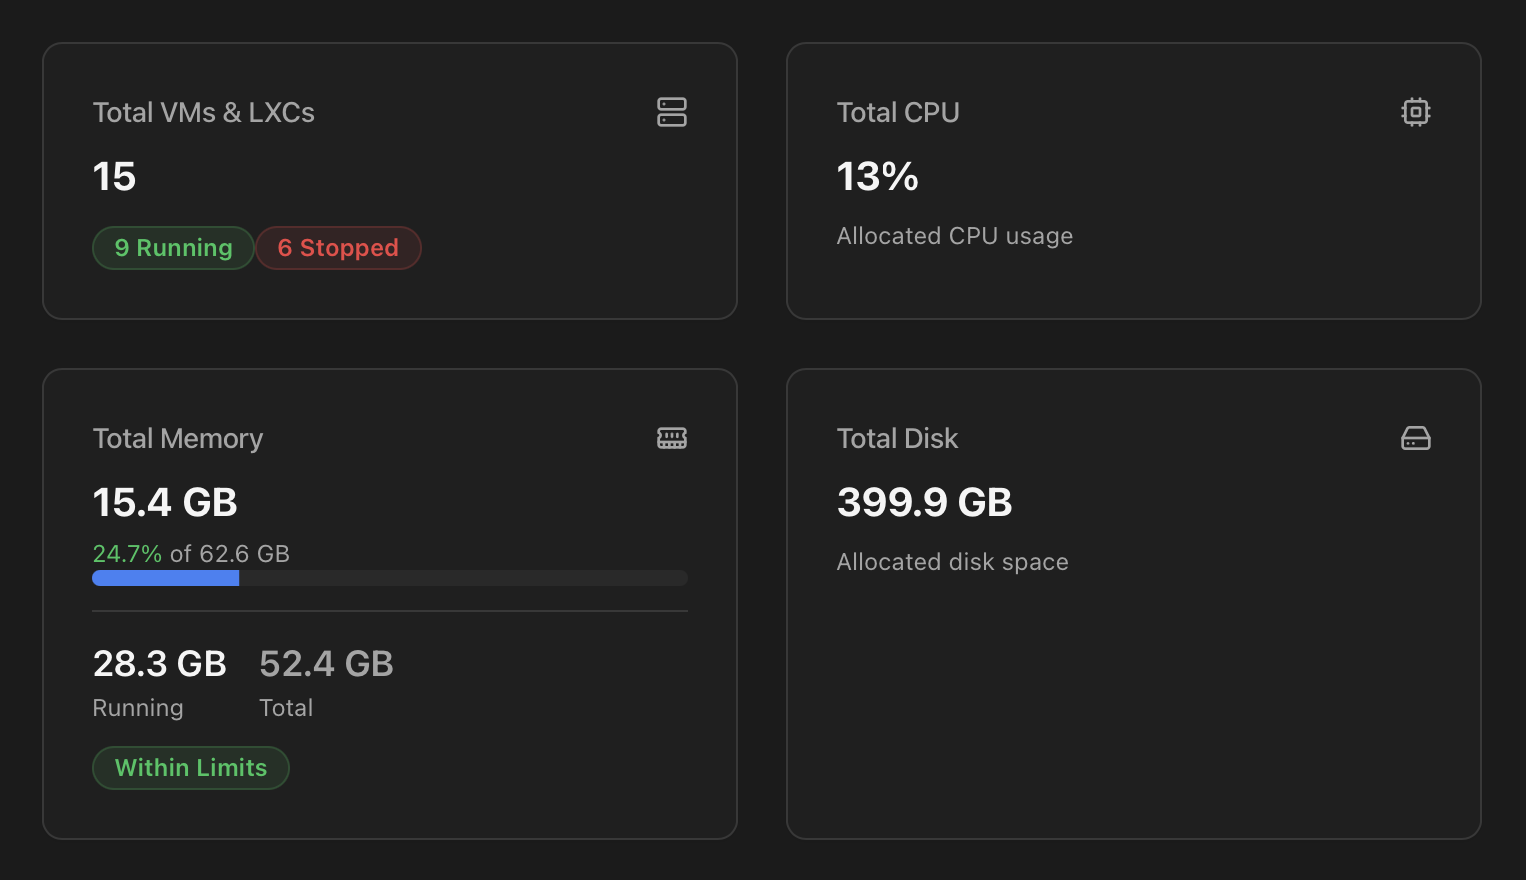
Opening the VMs & LXCs tab lands you on a four-card summary of guest state — totals, CPU utilisation, memory commitment vs host capacity, and disk allocation.
| Card | What it shows |
|---|---|
| Total VMs & LXCs | Total count with two badges — X Running (green) and Y Stopped (red, only when > 0). The number you watch when something didn't come back up after a reboot. |
| Total CPU | Aggregate live CPU utilisation across all guests as a percentage of the host's physical CPU, with a footer line "Allocated CPU usage". |
| Total Memory | Three readings stacked vertically:
|
| Total Disk | Sum of disk space allocated across all guests, in the appropriate unit (GB / TB), with the footer line "Allocated disk space". |
Virtual Machines & Containers list
One row per guest. The list is single-sourced from /api/vms, which consolidates qm list + pct list + pvesh /cluster/resources on the host.
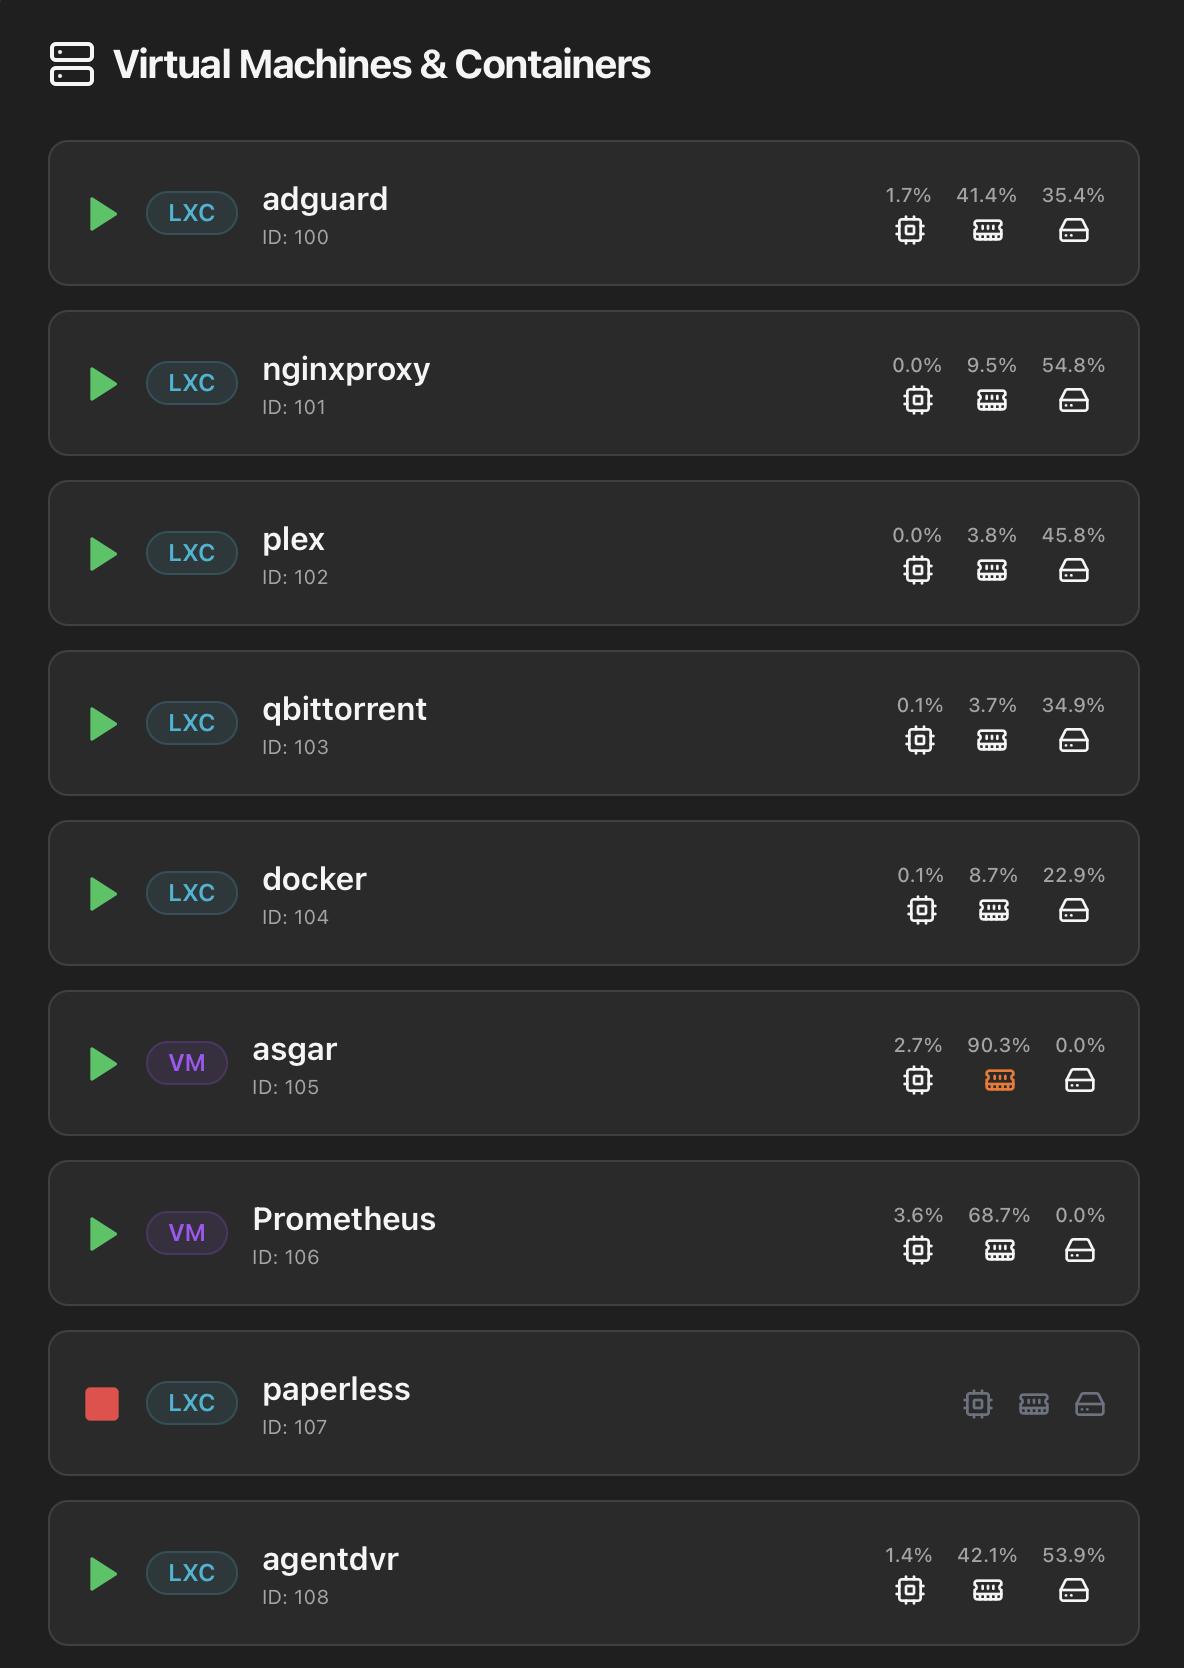
Each row shows:
- Status icon — green play (running) or red square (stopped). For stopped guests, the rest of the row dims so you instantly see what's offline.
- Type badge — LXC (cyan) for containers, VM (purple) for virtual machines.
- Name — guest hostname / display name.
- VMID — the Proxmox numeric ID below the name.
- Inline metrics — three percentages with their icon (CPU %, Memory %, Disk %). Each icon turns orange when the metric crosses an attention threshold (e.g. memory above 90 %), so a quick scan tells you which guest is under pressure without opening it.
Clicking any row — running or stopped — opens the drill-in modal described below.
The list is built mobile-first
Per-guest drill-in modal
The modal opens with a header showing the guest name, VMID, type badge (LXC / VM), state badge (RUNNING / STOPPED / …) and current uptime. Below the header are two tabs — Status and Backups — and a fixed action bar at the bottom of the modal with the four lifecycle controls (Start / Shutdown / Reboot / Force Stop) and, on running LXC containers, a Console button.
Tab 1 — Status
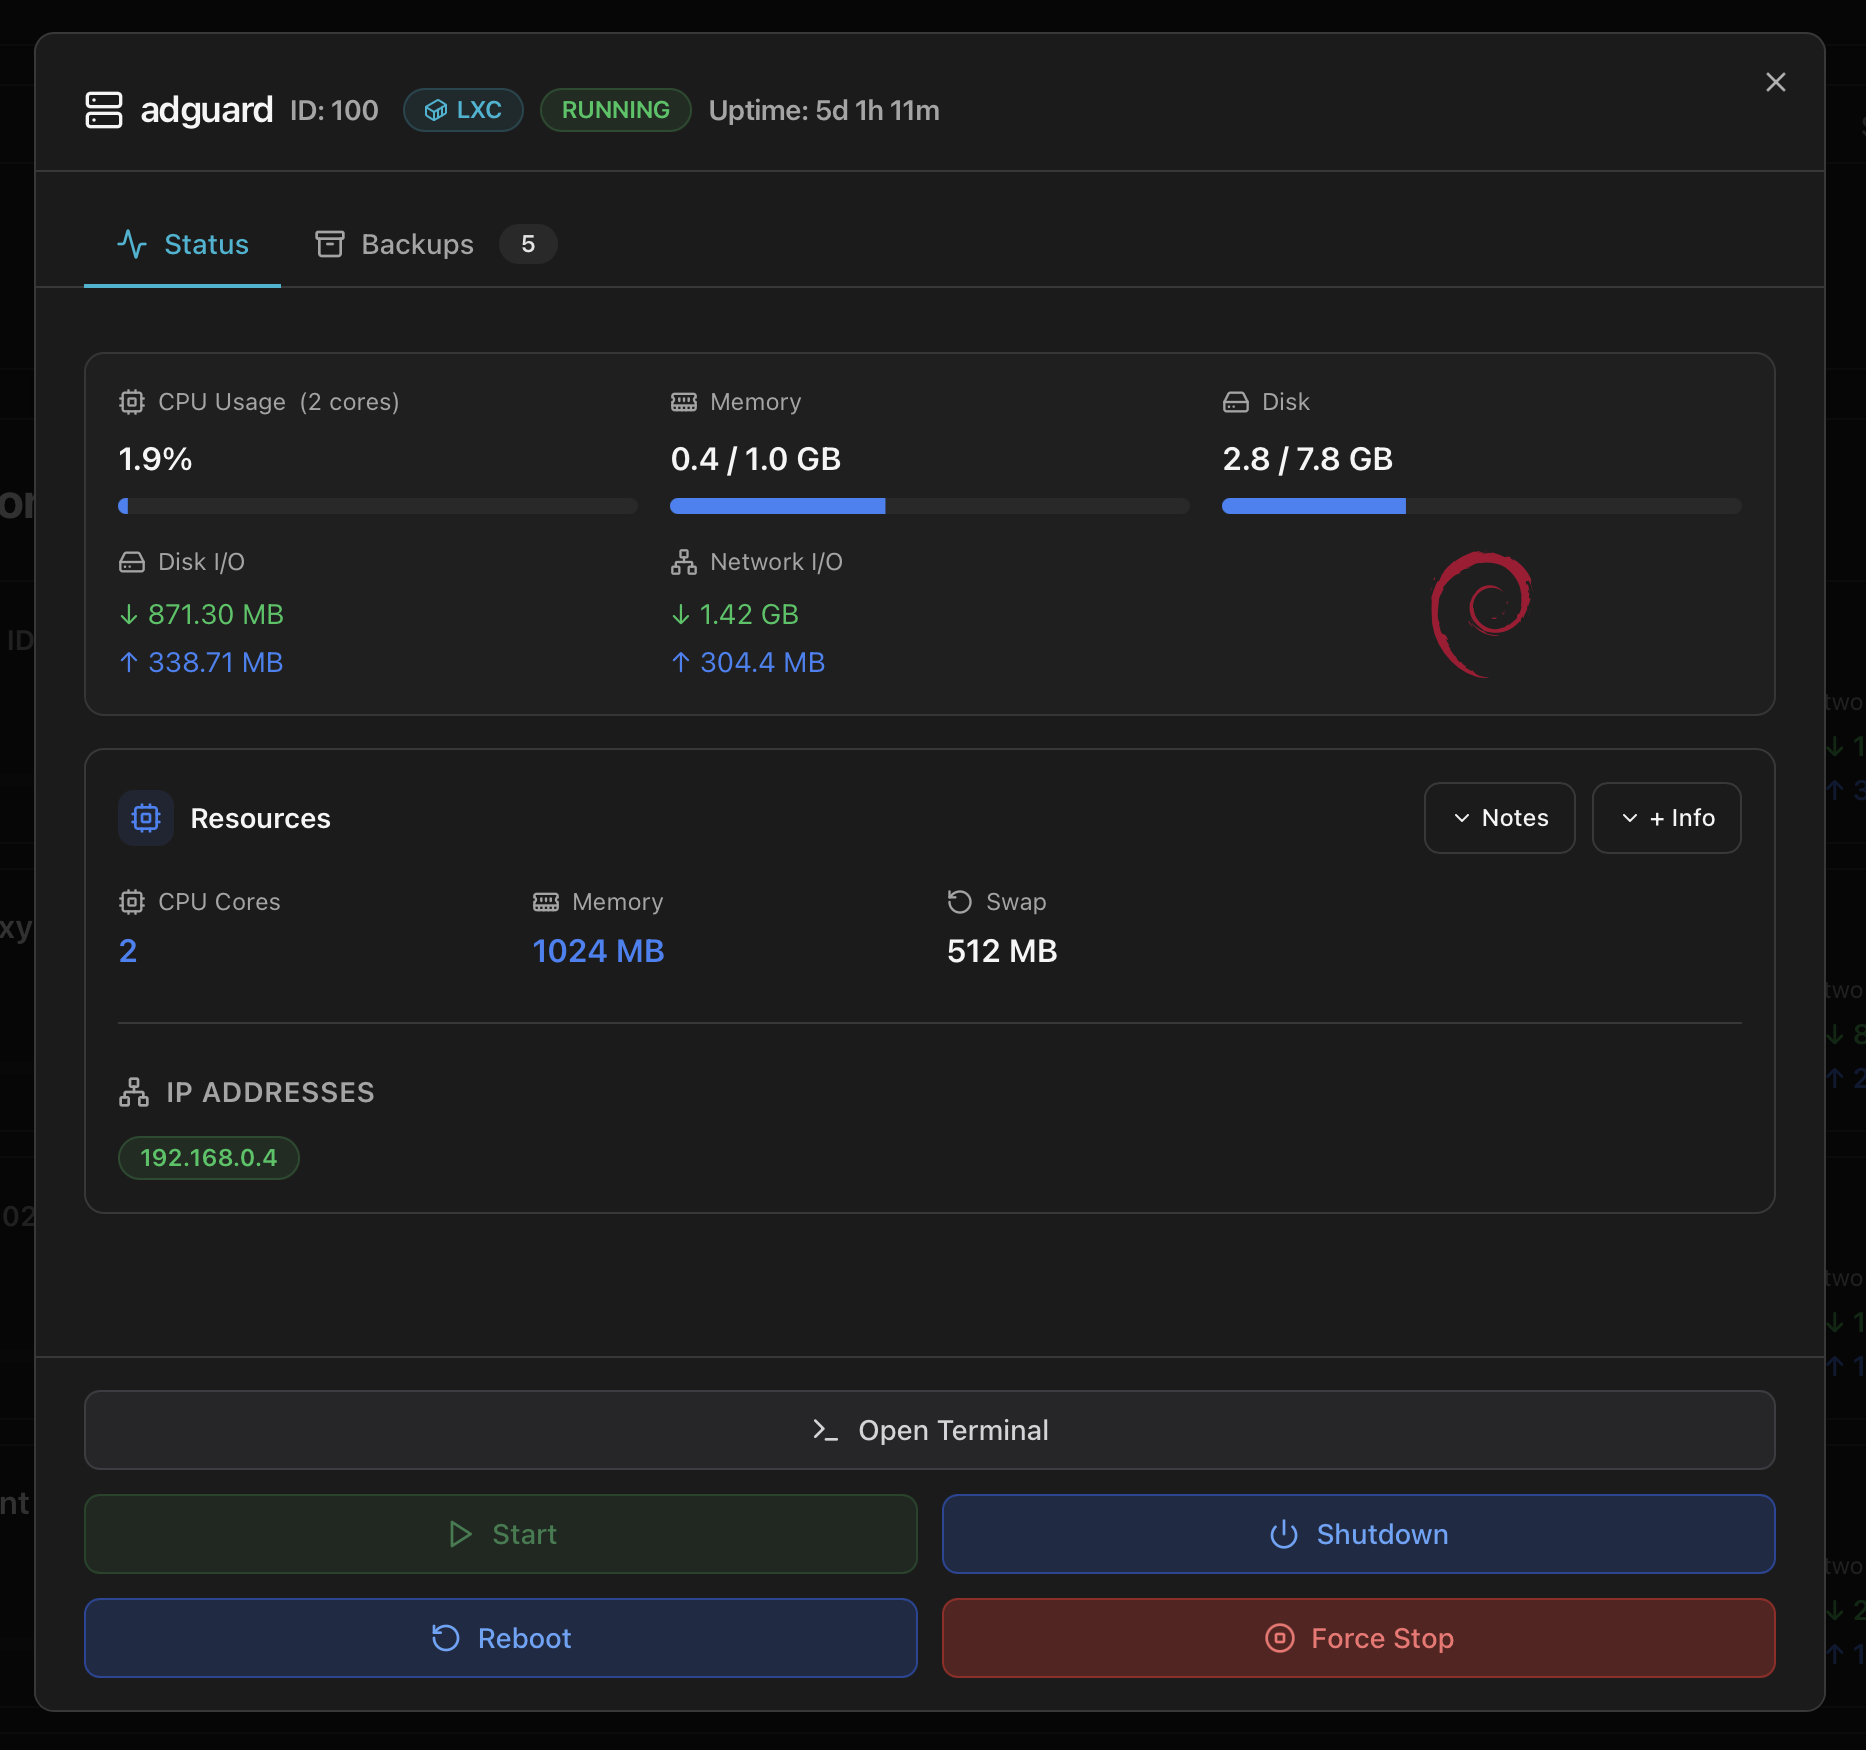
The default tab — the "is this guest behaving?" view. Three blocks:
1. Live metrics row
- CPU Usage (X cores) — current percentage with a progress bar. The header shows the configured core count so you know what 100 % would mean.
- Memory — used / max in GB with a progress bar.
- Disk — used / max across the guest's primary disk image, same shape.
2. I/O totals + OS logo
- Disk I/O — accumulated read (↓) and write (↑) totals since boot. Useful to spot a guest that's suddenly become I/O-heavy compared to its baseline.
- Network I/O — accumulated download (↓) and upload (↑). Same idea on the network side.
- OS distro logo — the Debian / Ubuntu / Alpine / Windows / etc. icon detected from the guest's OS type. A quick visual cue when scrolling several modals open.
3. Resources block
The configuration of the guest as Proxmox sees it — CPU Cores, Memory (configured maxmem), Swap. Two collapsible buttons in the block header:
- Notes — the guest's description field. Editable: typing here and saving calls
PUT /api/vms/<vmid>/configand writes back to/etc/pve/qemu-server/<vmid>.confor/etc/pve/lxc/<vmid>.conf. - + Info — extra fields that are too verbose for the default view: bios mode, machine type, agent state, hostpci passthrough entries, mount points (CT), boot order.
4. IP Addresses
Pill list of every IPv4 / IPv6 address the guest currently exposes — green pill per address. Empty when the guest is stopped or when the QEMU agent isn't installed in a VM (LXCs always report addresses directly).
Tab 2 — Mounts (LXC only)
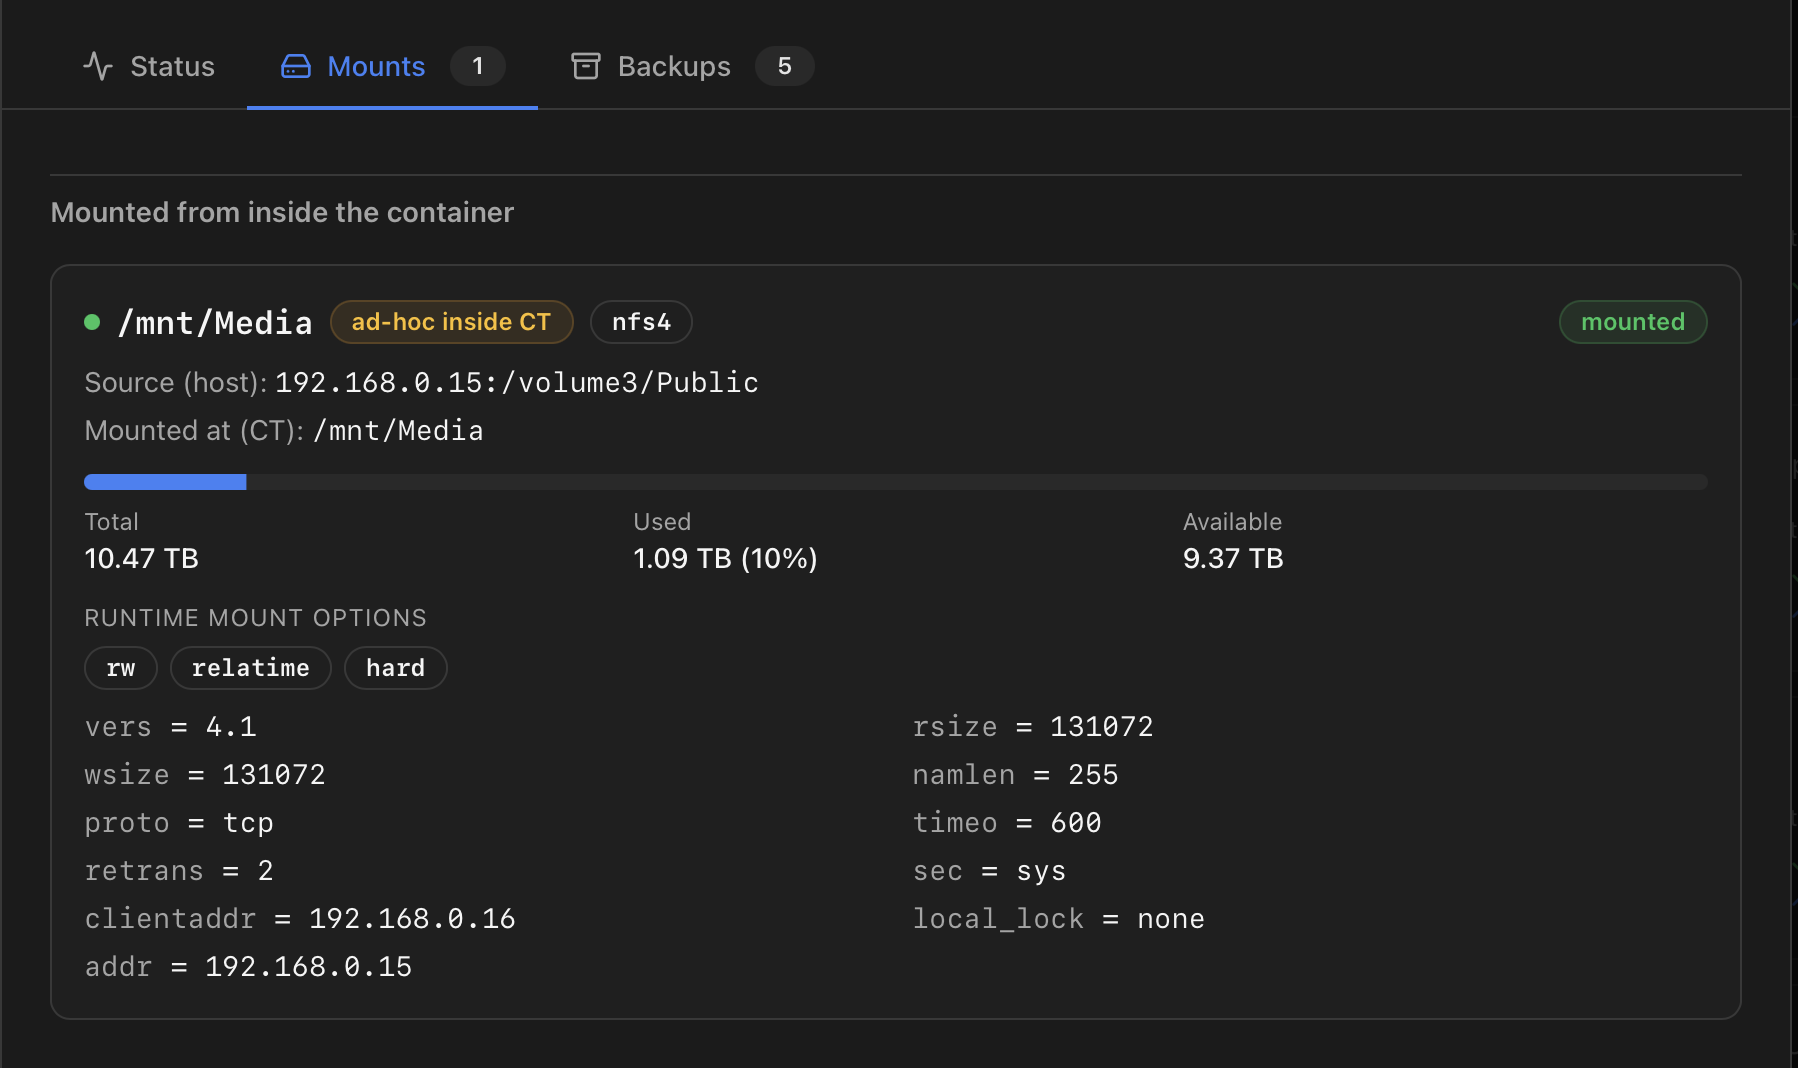
Proxmox's own UI shows the mount-point entries defined in the container config (mpX) but stops there — anything you mount from inside the CT later (mount.cifs, NFS via autofs, …) is invisible. This tab merges both views: the configured mounts and the runtime mounts ProxMenux probes from inside the container, with a per-mount health status and a capacity bar wherever the backend can resolve one.
Types of mount detected
- PVE volume — backed by a Proxmox-managed storage (a ZFS subvol, a directory entry, a Ceph RBD, …). Capacity comes from the PVE storage stats so the bar matches what Proxmox itself shows.
- Bind from PVE storage —
mpXentry pointing at a path on a PVE-known storage. - Bind from host —
mpXentry pointing at an arbitrary host path (/mnt/something). Capacity is thedfof that host path. - Ad-hoc inside CT — mount that only exists in the container's mount namespace (e.g. an NFS share that the CT mounts on its own). Capacity is read via
pct exec <vmid> df, which is the only way to see it —/proc/<pid>/rootfrom the host doesn't expose the remote mount's real stats.
Per-card state dot and warnings
- <green/> Green — mount is healthy and reachable.
- <amber/> Amber — divergent (configured but not actually mounted), read-only, or zombie bind (the host source was removed but the CT still sees the bind as mounted — typical when a USB drive was unplugged or a manual
umounthappened on the host). - <red/> Red — stale: the runtime probe couldn't reach the mount (common with NFS exports whose server is down).
What this gives you over the native UI
Tab 3 — Backups
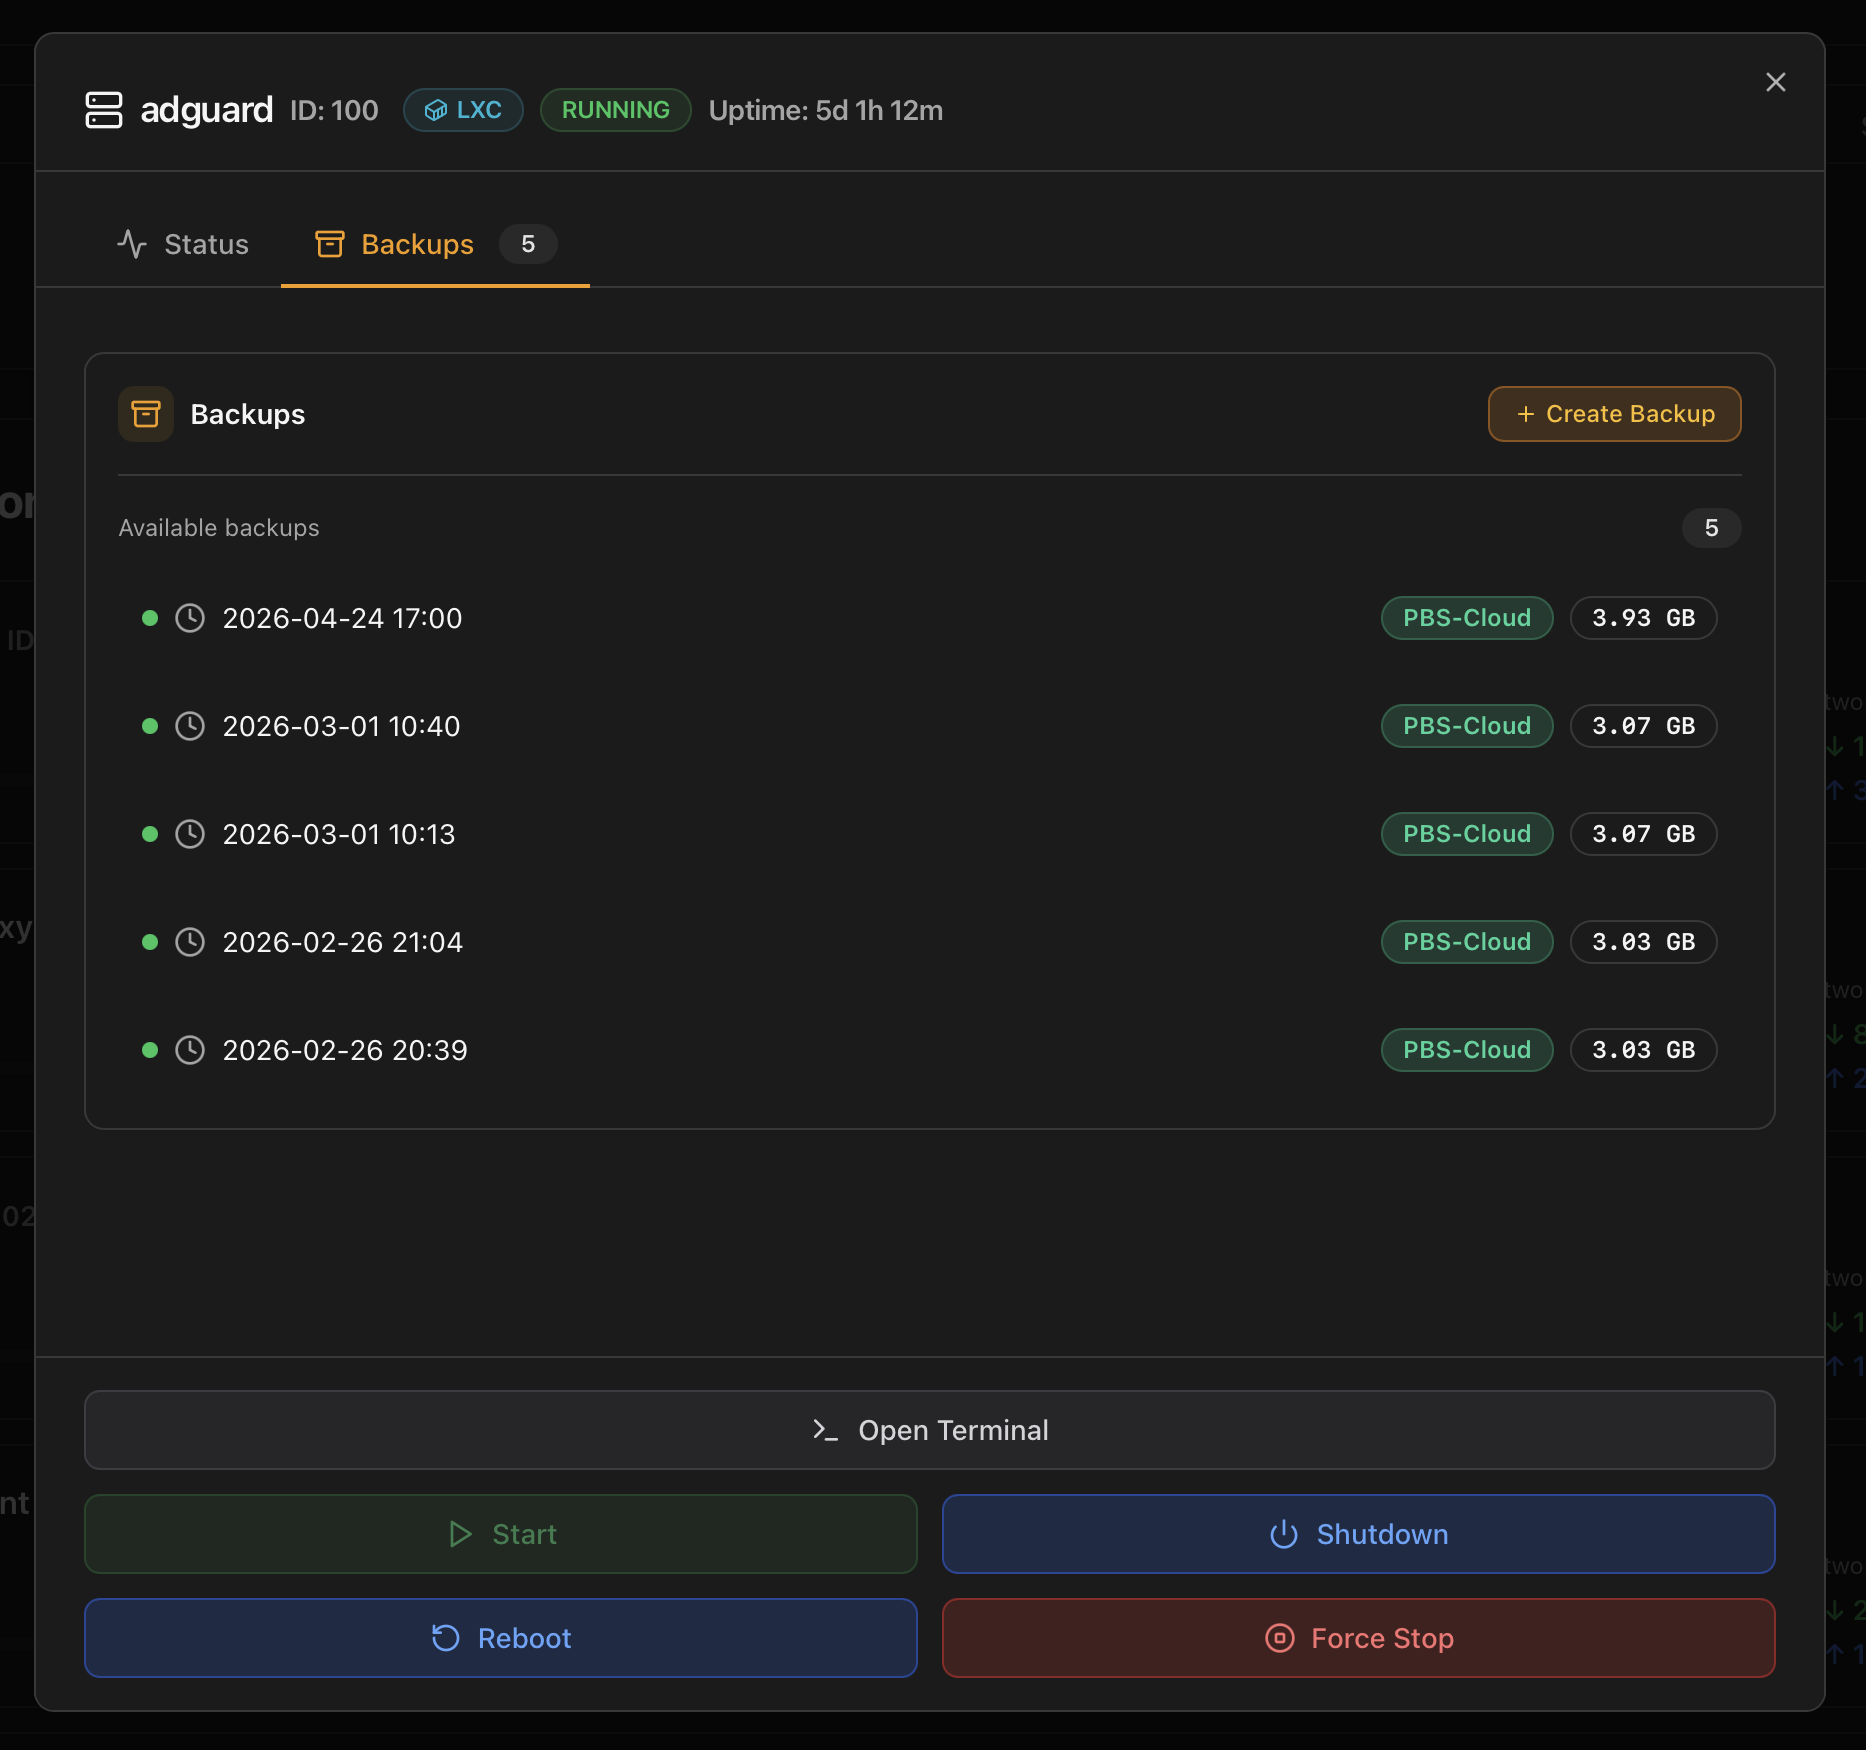
Lists every backup stored across configured Proxmox storages for this guest, sorted newest first. The tab title carries a count badge so you see at a glance whether the guest is backed up. Per row:
- Timestamp — date and time of the run.
- Destination tag — the storage where it lives (PBS-Cloud, PBS-Local, NFS-Backup, …) coloured by status.
- Size — final on-disk size of the backup.
The + Create Backup button at the top right kicks off a new run on the storage marked as "Backup target" in the Proxmox storage config. Restore lives in the Proxmox web UI — the Monitor exposes the "is this guest backed up recently?" view, not the recovery flow.
Updates badge (LXC only)
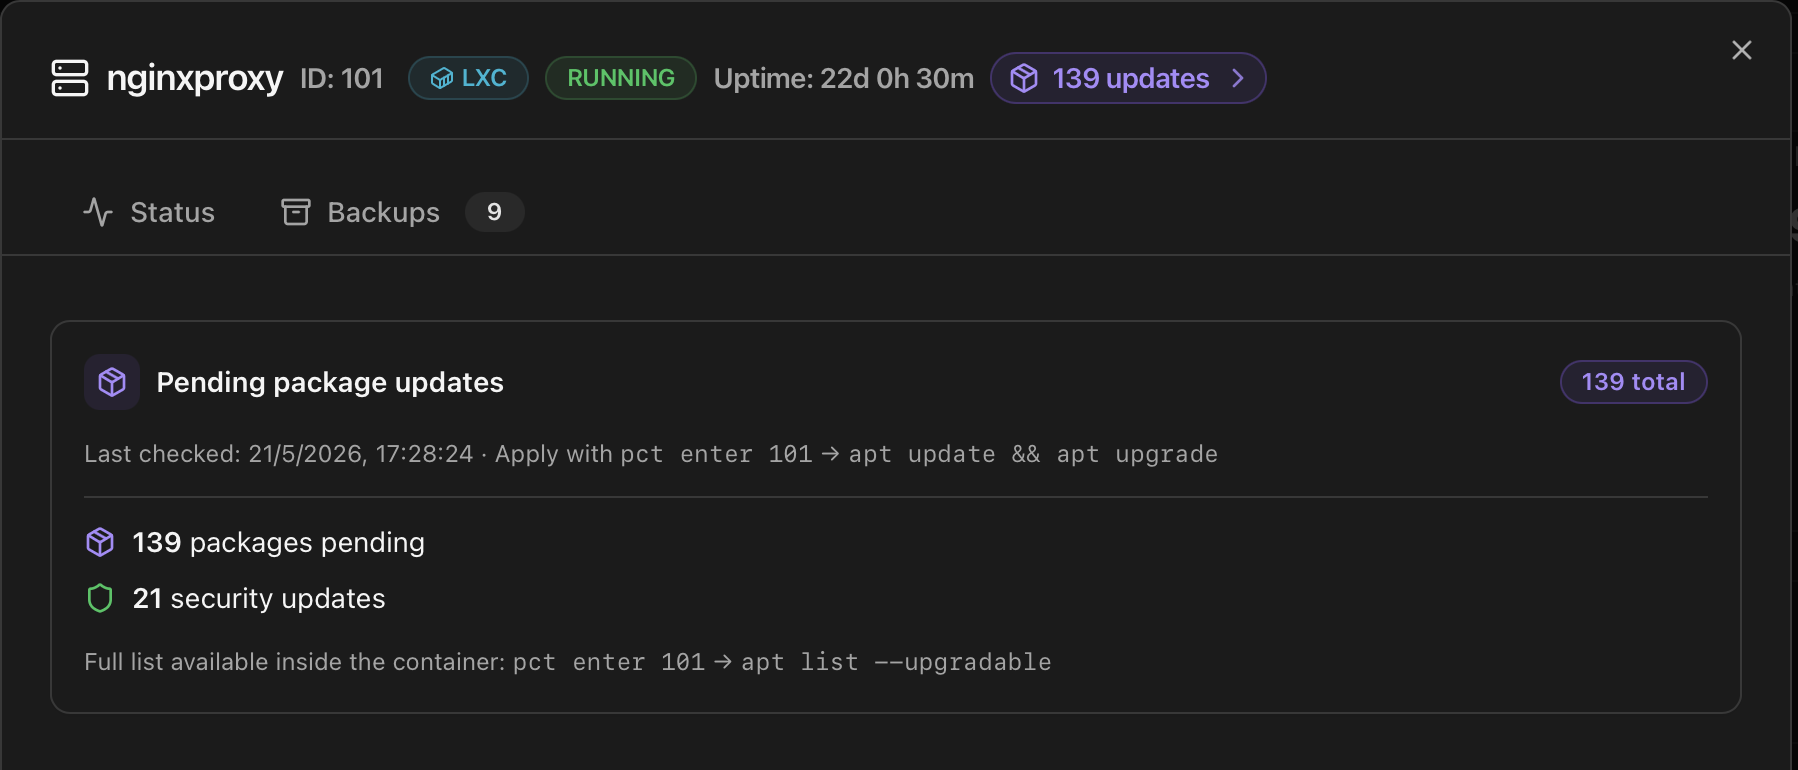
ProxMenux probes every running container on the host once a day and counts the upgradable packages. Currently supported in this phase: Debian / Ubuntu via apt list --upgradable and Alpine via apk list -u. Containers running other distributions (CentOS, Arch, …) are skipped for now — they show no badge instead of a misleading zero.
What the panel shows
- Total upgradable count at the top, plus a separate security counter when the underlying repository flags any of the packages as security (Debian/Ubuntu "-security" suite). Alpine doesn't expose a separate security suite via apk metadata, so security is always 0 on Alpine containers.
- Per-package list with name, current version and target version. Use this to decide whether to run the upgrade now or wait for a maintenance window.
What the system tracks vs what the script counts
This update detector follows whatever is already installed inside the container — it does not install anything new and does not know about applications that were deployed outside apt / apk (a Docker container running inside the LXC, a Vaultwarden installed from source, a binary dropped into /usr/local/bin). It is a package-manager view, not an application view. Future phases of this work will integrate community-script application metadata so per-app upstream tracking (Vaultwarden, Jellyfin, …) becomes possible.
Detection vs notification — toggle semantics
Detection is always on; the toggle only controls the notification
lxc_updates_available notification toggle in Settings → Notifications only controls whether a grouped "N CT(s) have pending updates" message is delivered to your channels. This keeps the toggle semantics consistent with every other update stream (NVIDIA driver, Coral driver, ProxMenux optimizations): turning notifications off never hides the information in the dashboard.Applying the updates
Open the container shell from the bottom action bar, or use pct exec <vmid> -- apt full-upgrade -y / pct exec <vmid> -- apk upgrade -y from the host. The dashboard re-scans on its 24h cycle (or after the next manual refresh) and the badge updates.
Tab 5 — Firewall
Reads the per-guest Proxmox firewall log straight from the host (no extra service, no polling). The tab is always present in the navigation strip; the panel decides what to render depending on whether the firewall is enabled for that guest and whether any rule is actually logging:
- Firewall disabled — an amber notice explains exactly where to enable it in the Proxmox UI (<Container|VM> → Firewall → Options) and reminds you that at least one rule needs
log: info(or higher) before packets show up. - Firewall enabled, no events yet — empty-state hint with the same logging requirement, useful when you just turned the firewall on.
- Events present — a scrollable monospace pane with the raw entries coloured by action: ACCEPT (green), REJECT (orange), DROP (red). A count badge in the header shows how many entries are currently loaded.
A Refresh button at the top right of the panel pulls the latest entries on demand — there is no auto-refresh inside the modal, so the list is a snapshot of the moment you opened the tab or pressed refresh. The data comes from the per-guest log file that Proxmox writes under /var/log/pve-firewall.log filtered by VMID, exposed via GET /api/vms/<vmid>/firewall/log.
Why have it here when the Proxmox UI already shows it?
Bottom action bar
Always visible at the foot of the modal regardless of which tab is active:
- Console (LXC only, running) — opens a modal that runs
pct enter <vmid>and lands you inside the container. Same xterm.js + WebSocket plumbing as the standalone Terminal tab, including the mobile-friendly toolbar with ESC, TAB, arrow keys, Enter and the Ctrl combos (Ctrl+C / Ctrl+X / Ctrl+R) under the terminal — making the modal usable from a phone or tablet keyboard. VMs do not expose a Console button here; use the Proxmox web console (noVNC) for guest access.
Below it, four lifecycle buttons in a 2×2 grid. Each fires POST /api/vms/<vmid>/control with the matching action; enabled state depends on whether the guest is currently running:
| Button | Enabled when | Action sent to host |
|---|---|---|
| Start | Guest is stopped. | qm start / pct start |
| Shutdown | Guest is running. | qm shutdown / pct shutdown — graceful, ACPI |
| Reboot | Guest is running. | qm reboot / pct reboot — graceful restart |
| Force Stop | Guest is running. | qm stop / pct stop — hard power-off |
Force Stop is the kill switch, not the polite option
How the data is collected
| Section of the tab | Endpoint | Source |
|---|---|---|
| Inventory list | /api/vms | pvesh get /cluster/resources --type vm for VMs and CTs. |
| Detail panel (config, network, disks) | /api/vms/<vmid> | qm config <id> for VMs / pct config <id> for CTs. |
| Per-guest metrics chart | /api/vms/<vmid>/metrics | PVE RRD data (pvesh get /nodes/<node>/qemu/<id>/rrddata) condensed to a chart-friendly shape. |
| Recent task logs (modal) | /api/vms/<vmid>/logs | Tasks for that vmid from /var/log/pve/tasks/index. |
| Backups available for guest | /api/vms/<vmid>/backups | pvesm list <storage> filtered by VMID. |
| Per-guest firewall log (Firewall tab) | /api/vms/<vmid>/firewall/log | /var/log/pve-firewall.log filtered by VMID. |
| Power buttons (Start / Stop / Reboot / Shutdown) | /api/vms/<vmid>/control | qm start|stop|reboot|shutdown or pct equivalents. |
# Cross-check what the dashboard sees against PVE
pvesh get /cluster/resources --type vm --output-format=json | jq

# Inspect a specific guest's config exactly as the modal sees it
qm config 100   # VM
pct config 100  # CT
Where to next
- Health Monitor — the VMs & Containers category (failed boot, QMP timeouts, CT shutdown failures).
- Notifications — what the
vm_*,ct_*,migration_*andbackup_*events trigger downstream. - API Reference — the VM and backup endpoints.
- Dashboard index — the other tabs.
- ProxMenux → Create VM — provisioning side: System NAS templates (Synology and others), Linux / Windows VMs, defaults tailored for Proxmox.