Dashboard: Settings tab
Dashboard preferences, monitoring exclusions, the embedded notification + AI configuration panel, and a live inventory of the ProxMenux post-install optimizations currently active on the host.
Where each setting actually lives
Network Units
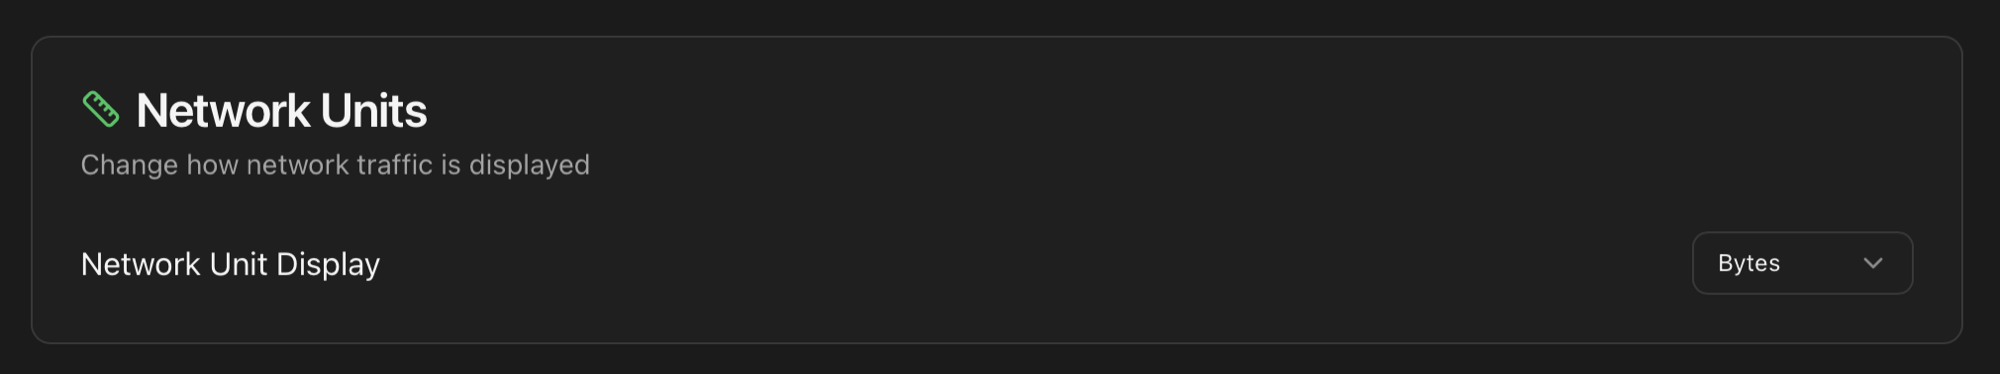
Choose how network throughput is displayed across the dashboard: bits per second (Mbps / Gbps) or bytes per second (MB/s / GB/s). Bits is the default because it's what NIC vendors and ISPs label their products with; bytes is what most file-transfer tools report. The setting affects every chart, badge and tooltip that shows network rate — applied immediately, no reload needed.
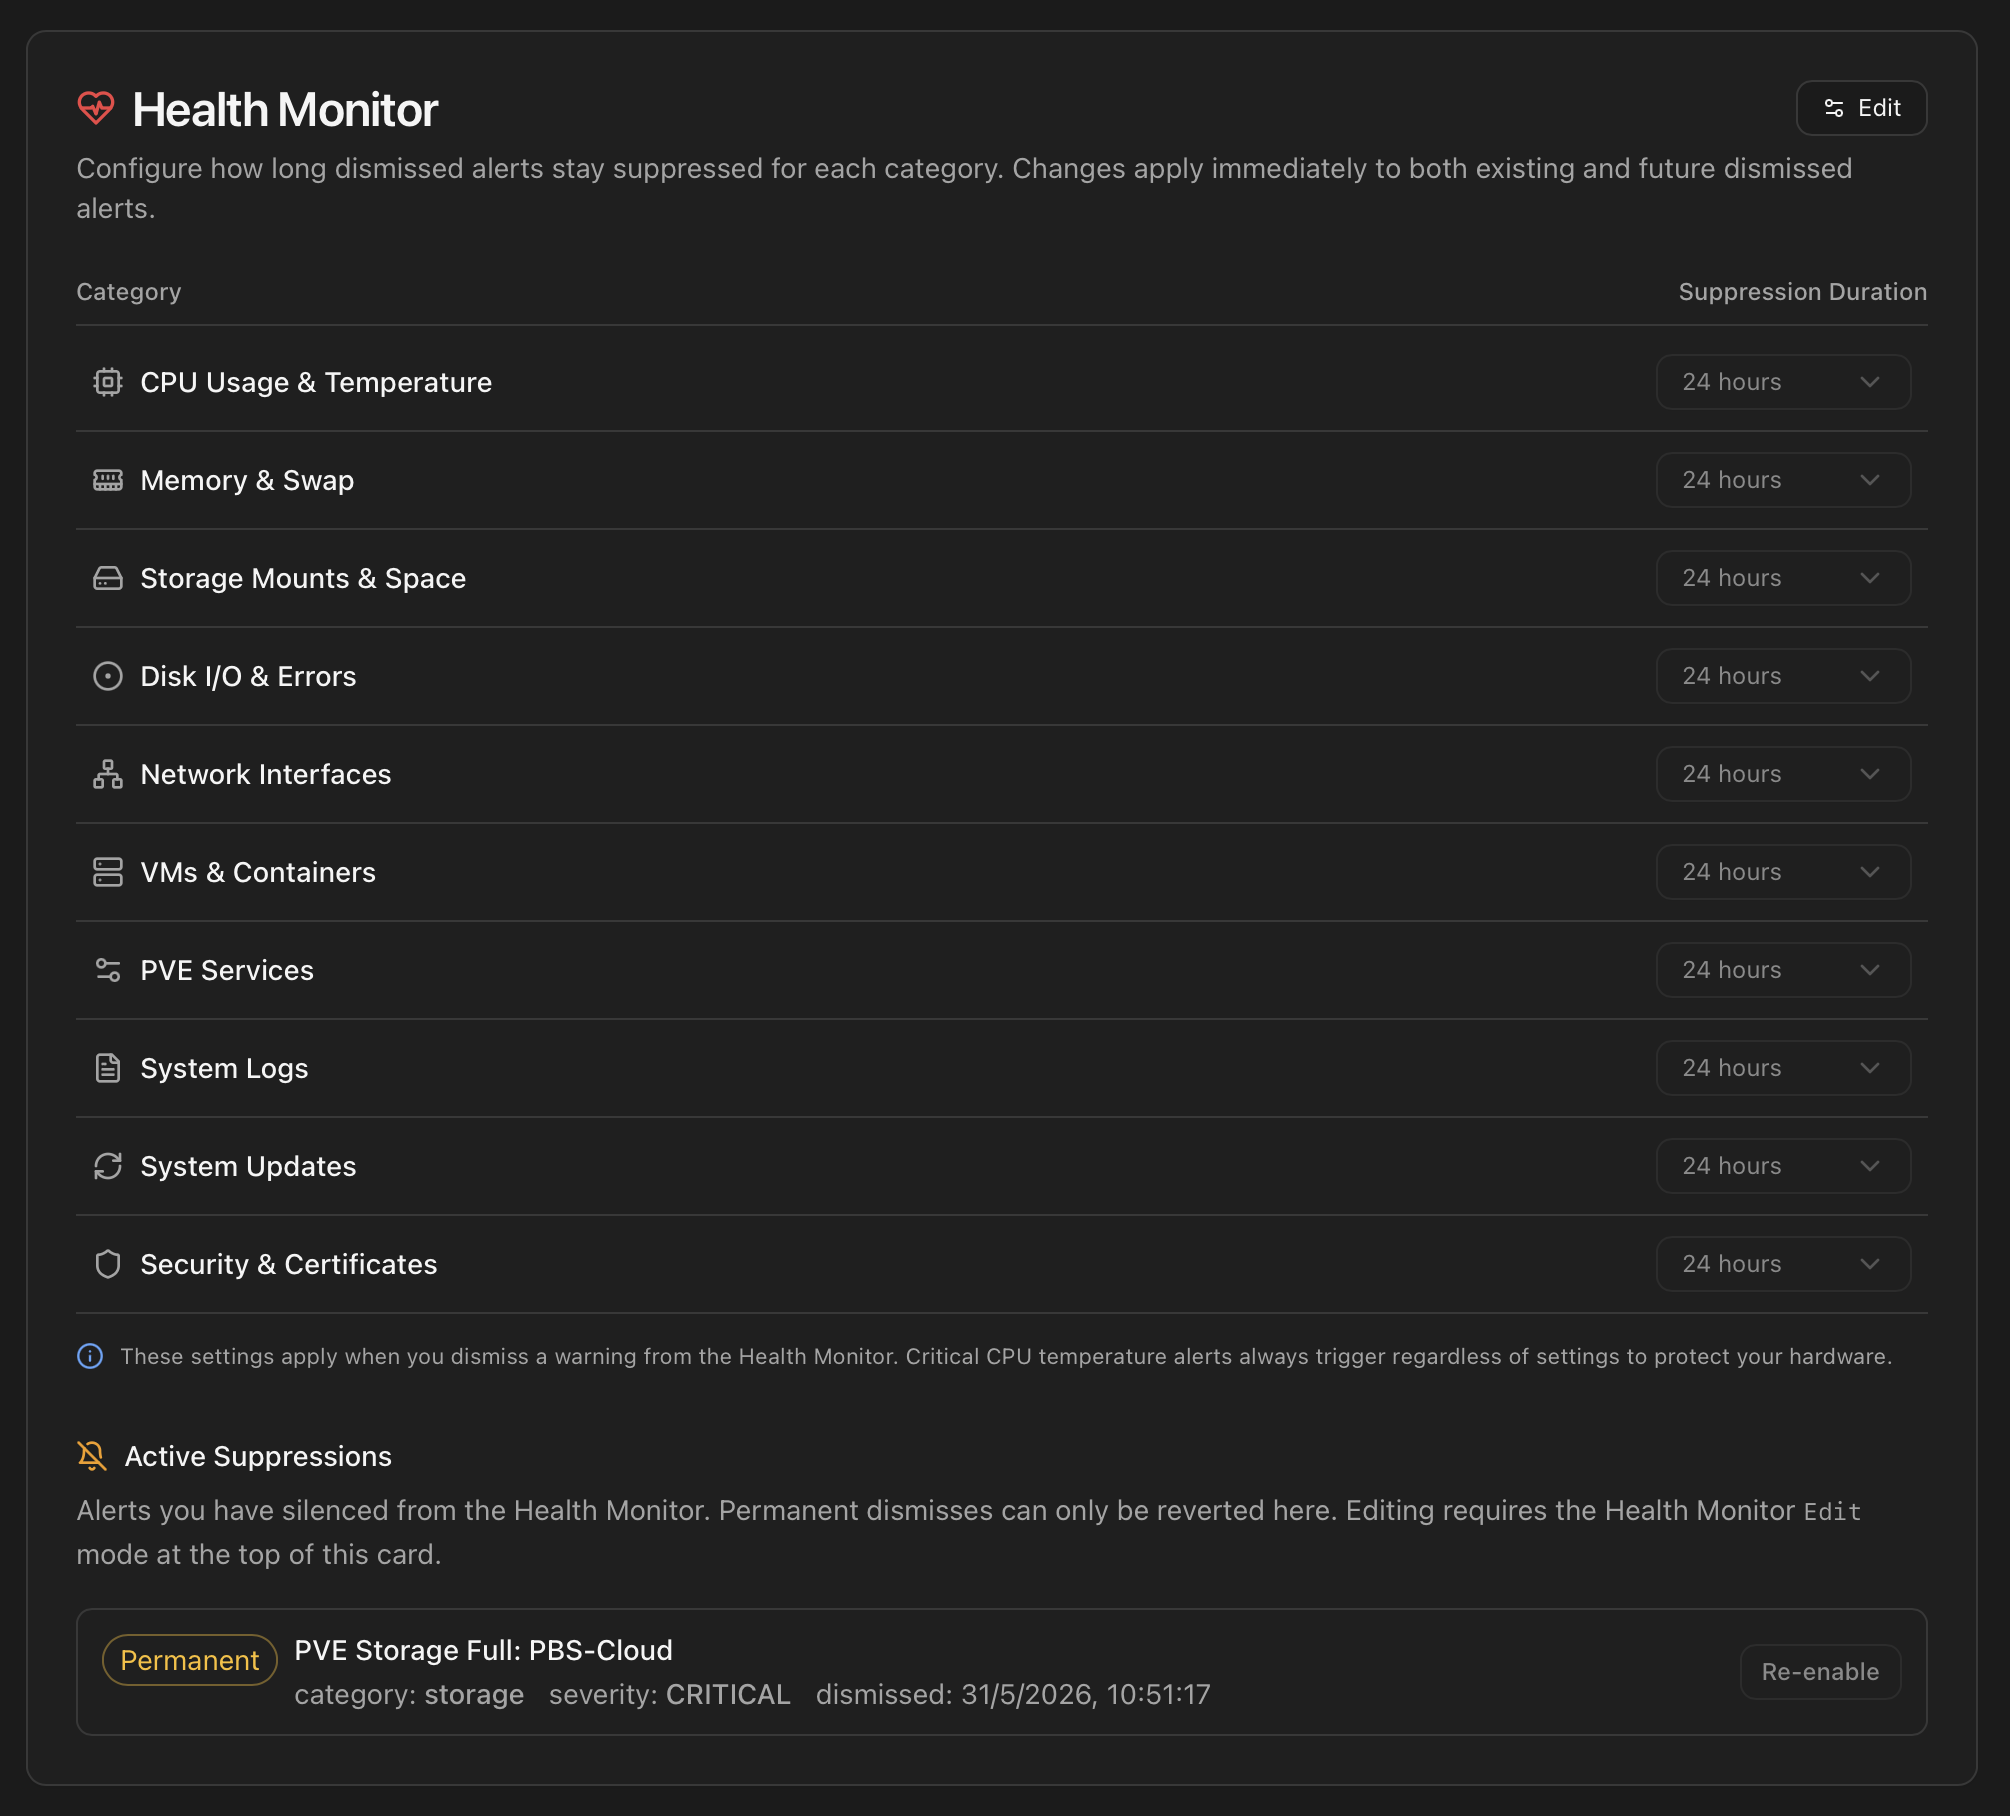
Health Monitor
The card surfaces the per-category Suppression Duration setting — once an alert is dismissed, how long before the scanner is allowed to re-fire it. Each of the ten Health Monitor categories (CPU, Memory, Storage, Disks, Network, VMs, PVE Services, Logs, Updates, Security) has its own dropdown with these values:
- 24 h — default for most transient categories.
- 72 h — for events you want a few days of silence on.
- 168 h (1 week) and 720 h (1 month) — periodic checks.
- 8760 h (1 year) — effectively "quiet for the foreseeable future".
- -1 — permanent silence until you re-enable it manually.
- Custom hours — any integer if you need an in-between value.
Edit mode
The card is read-only by default. Click Edit in the top-right of the card to enable the dropdowns and the Re-enable buttons. Save commits every pending change (suppression-duration changes and queued re-enables) in a single batch; Cancel discards them all. The Save button only activates when there is at least one pending change.
Active Suppressions
Below the suppression-duration dropdowns, the Active Suppressions section lists every alert that is currently silenced — both time-limited dismisses (24 h, 7 days, custom windows) and Permanent ones. Each row shows:
- A coloured badge — Permanent (amber) or a countdown such as 24h remaining / 7d remaining (blue).
- The alert identifier, normalized for readability (e.g.
pve_storage_full_PBS-Cloud→ PVE Storage Full: PBS-Cloud). - Category, severity and the timestamp the alert was dismissed.
- A Re-enable button (active only in Edit mode) that queues the alert to be un-acknowledged on the next Save.
Re-enable flow
Clicking Re-enable in Edit mode marks the row in green and strikes its identifier — it is queued but not yet applied. Click again on the same row to Undo the queue. When you press Save, every queued re-enable fires POST /api/health/un-acknowledge in parallel and the affected rows disappear from the list. If the underlying condition is still present and the category supports re-firing, the alert reappears in the Health Monitor's Active list on the next scan cycle.
Auto-refresh
Permanent dismisses (alerts dismissed with Permanently from the Health Monitor modal, or those whose category default is set to -1) can only be reverted from here. The dashboard modal does not expose an un-dismiss button for them — the Active Suppressions panel is the single audit log + revert UI.
Full semantics live in the Health Monitor page
Health Monitor Thresholds
Where the previous card decides how long to stay quiet after a dismiss, this one decides at what value an alert fires in the first place. Every check the Health Monitor runs is parameterised by a pair of numbers — a Warning threshold and a Critical threshold — and both are exposed here for the operator to tune.
What it is for
Defaults that ship with ProxMenux are sane for the average Proxmox host, but every environment has its own envelope:
- A small homelab with a single-disk SSD may want to page earlier on capacity (75 / 90 %) to leave room for snapshots.
- A datacenter host with redundant Ceph nodes can be more relaxed on memory warnings (a 90 % working set is normal under ZFS ARC).
- A passively-cooled mini-PC needs lower temperature thresholds than a server with forced-air cooling — same drive class, different physical envelope.
- A heavily-virtualized host that pegs CPU during builds should not page on every 80 % spike, but must still alert on sustained pressure.
Editing a threshold takes effect on the next scan — the Health Monitor re-reads the values from /usr/local/share/proxmenux/health_thresholds.json on every cycle, no service restart needed. The same numbers also feed the colour ranges of the dashboard widgets (the temperature line in the disk-temperature modal, the bars on the storage cards) so the visual classification matches what triggers the alert.
Status colours: how Warning and Critical render in the dashboard
Every threshold below produces the same three-state classification across the dashboard — same colours for storage bars, CPU/memory rings, temperature chips, and the dot on the disk modal. Reading a colour anywhere in the Monitor maps to a definite range relative to the configured pair:
| Colour | Range | Meaning |
|---|---|---|
| Green | value < Warning | Normal operating range. No alert fires. |
| Amber | Warning ≤ value < Critical | Warning state. The Health Monitor fires a WARNING-severity event; notifications respect the channel filters and Quiet Hours. |
| Red | value ≥ Critical | Critical state. The Health Monitor fires a CRITICAL event; CRITICAL bypasses Quiet Hours and always reaches the channel. |
Sections and recommended defaults
These are the values ProxMenux ships with — the recommended baseline. They're what you see on a fresh host until you override anything. Sections are ordered top-to-bottom from compute → heat → storage capacity so reading down moves from concrete (current load) to accumulated state (free space).
| Section | Warning | Critical | What it gates |
|---|---|---|---|
| CPU usage | 85 % | 95 % | Sustained-load alert when CPU averages above the threshold for the scan window. |
| Memory | 85 % | 95 % | RAM pressure on the host. |
| Swap (critical only) | — | 5 % | Swap actually being used. The number is intentionally low: a healthy Proxmox host should rarely touch swap, so even 5 % is a meaningful signal of RAM pressure. |
| CPU temperature | 80 °C | 90 °C | CPU package / core temperature reading from lm-sensors. |
| Disk temp — HDD | 60 °C | 65 °C | Standard spinning drives. Manufacturer envelope tops out around 60–65 °C, so Critical is set right at the hard limit. |
| Disk temp — SSD | 70 °C | 75 °C | 2.5' / M.2 SATA SSDs — run cooler than NVMe but warmer than HDDs. |
| Disk temp — NVMe | 80 °C | 85 °C | NVMe drives run hotter by design; controllers self-throttle above ~85 °C, so Warning catches the climb before throttling kicks in. |
| Disk temp — SAS | 55 °C | 65 °C | Enterprise SAS drives share the same ~65 °C manufacturer limit as HDDs, but are normally deployed in rack chassis with active cooling. A reading at 55 °C already signals a cooling problem (failed fan, HVAC issue) before the drive itself is at risk — hence a lower Warning than HDD, not because SAS is less heat-tolerant. |
| Disk space — host | 85 % | 95 % | Capacity of / and every host mountpoint (/var/lib/vz, /mnt/*…). |
| Disk space — LXC rootfs | 85 % | 95 % | Per-container root disk, evaluated against the rootfs size from PVE. |
| LXC mount points | 85 % | 95 % | Capacity of mountpoints inside running CTs (mp0, mp1, NFS, bind mounts). Excludes rootfs. |
| PVE storage | 85 % | 95 % | Block-style PVE storages (LVM, LVM-thin, ZFS-pool, RBD/Ceph, PBS). |
| ZFS pool | 85 % | 95 % | ZFS pools at host level — independent of PVE registration. |
Defaults, overrides and reset
Validation
LXC Update Detection
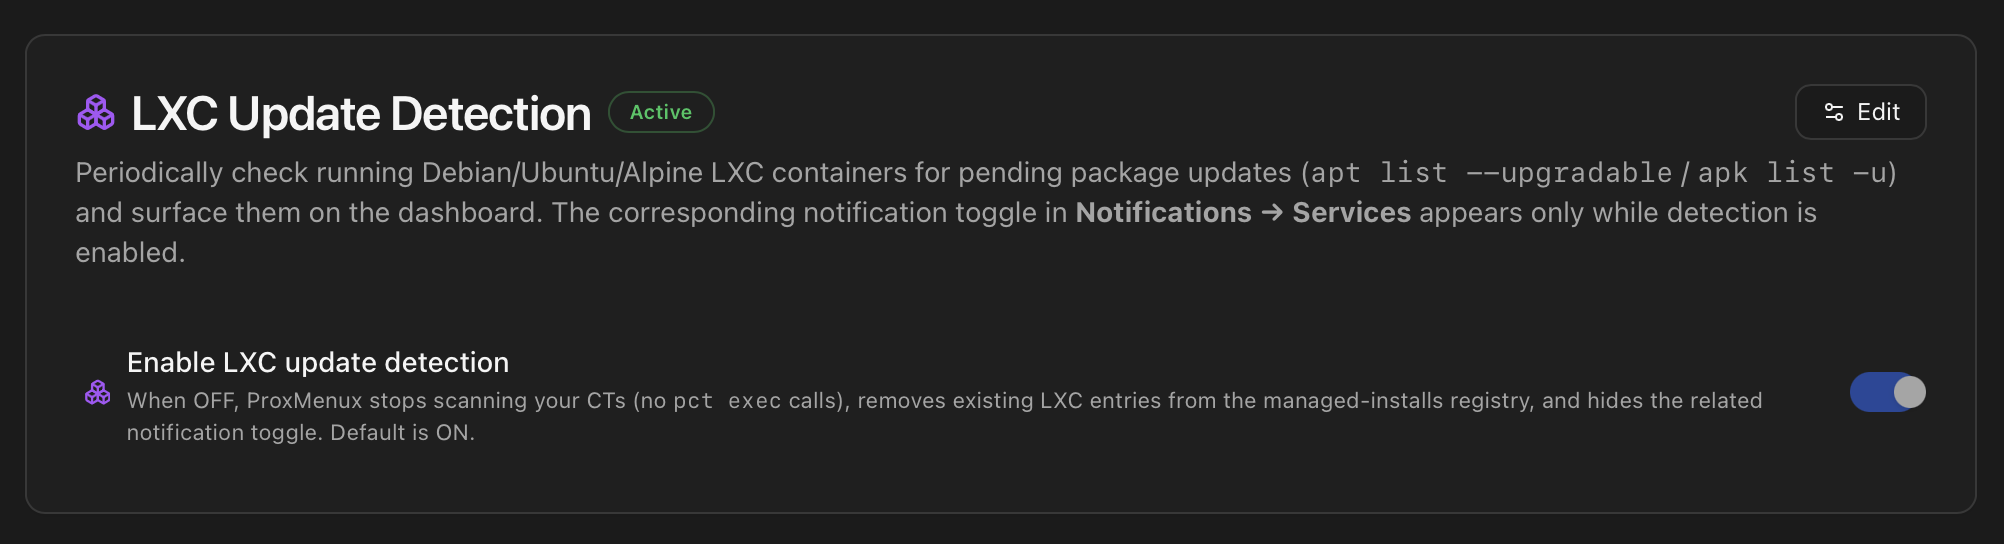
apt list --upgradable / apk list -u scan across every running CT. Default is ON. The matching notification toggle in Notifications → Services only appears while detection is enabled.A dedicated toggle for the LXC update scan, sitting between the Health Monitor Thresholds and the Notifications card. When ON, ProxMenux walks every running CT on the host and queries the in-container package manager for pending updates; results land in the Hardware tab badge counts and feed the lxc_updates_available notification. When OFF, the scan stops entirely (no pct exec calls) and any existing LXC entries in managed_installs.json are purged immediately, so the dashboard and the /api/managed-installs endpoint stop reporting LXC update state without waiting for the next 24h cycle.
What the scan actually runs
For each CT in running state with a supported package manager:
- Cache freshness gate. If the in-container apt/apk metadata cache is older than 24 hours, a best-effort refresh runs first (
apt-get update -qqon Debian/Ubuntu,apk updateon Alpine) with a 60 s timeout. Any failure (no network, broken repo, timeout) is swallowed silently — the listing below still runs against whatever cache exists, so a transient repo issue can never make detection worse than before. - Listing. Then ProxMenux runs
apt list --upgradable/apk list -uand parses the output into a structured count plus a sample of the top package names. - Per-CT dedup. A fingerprint built from count, security-count and the sorted top names is stored so a stable set of pending updates doesn't re-notify daily, while a meaningfully different set does.
CTs that self-update outside apt may legitimately report 0
plexupdate cron, Docker containers updated via docker pull, Frigate's built-in updater, etc.) will keep reporting low or zero apt updates even when the appliance is actively staying current — that's correct, not a bug. The apt-level base system on the same CT may still have its own pending updates, which the scan does surface.Why the 24 h auto-refresh
apt update inside them. Without the refresh, apt list --upgradable reports 0 updates from a frozen snapshot and the operator never sees the backlog. The threshold matches the rest of the check cycle — if the CT was refreshed within the last 24 h, ProxMenux trusts that signal and skips the refresh.Conditional notification toggle
The lxc_updates_available per-channel notification toggle in Notifications → Services only renders while detection is enabled. When you turn detection OFF, that row disappears from every channel's category list — but its stored preference is preserved in the DB, so re-enabling detection brings the toggle back at the value it had before.
What gets purged when you disable detection
type=lxc entry from /usr/local/share/proxmenux/managed_installs.json. The Hardware tab badges drop to zero on the next dashboard refresh. Turning it back ON repopulates the registry on the next detection cycle (or sooner if you trigger a manual refresh from the API).Remote Storage Exclusions
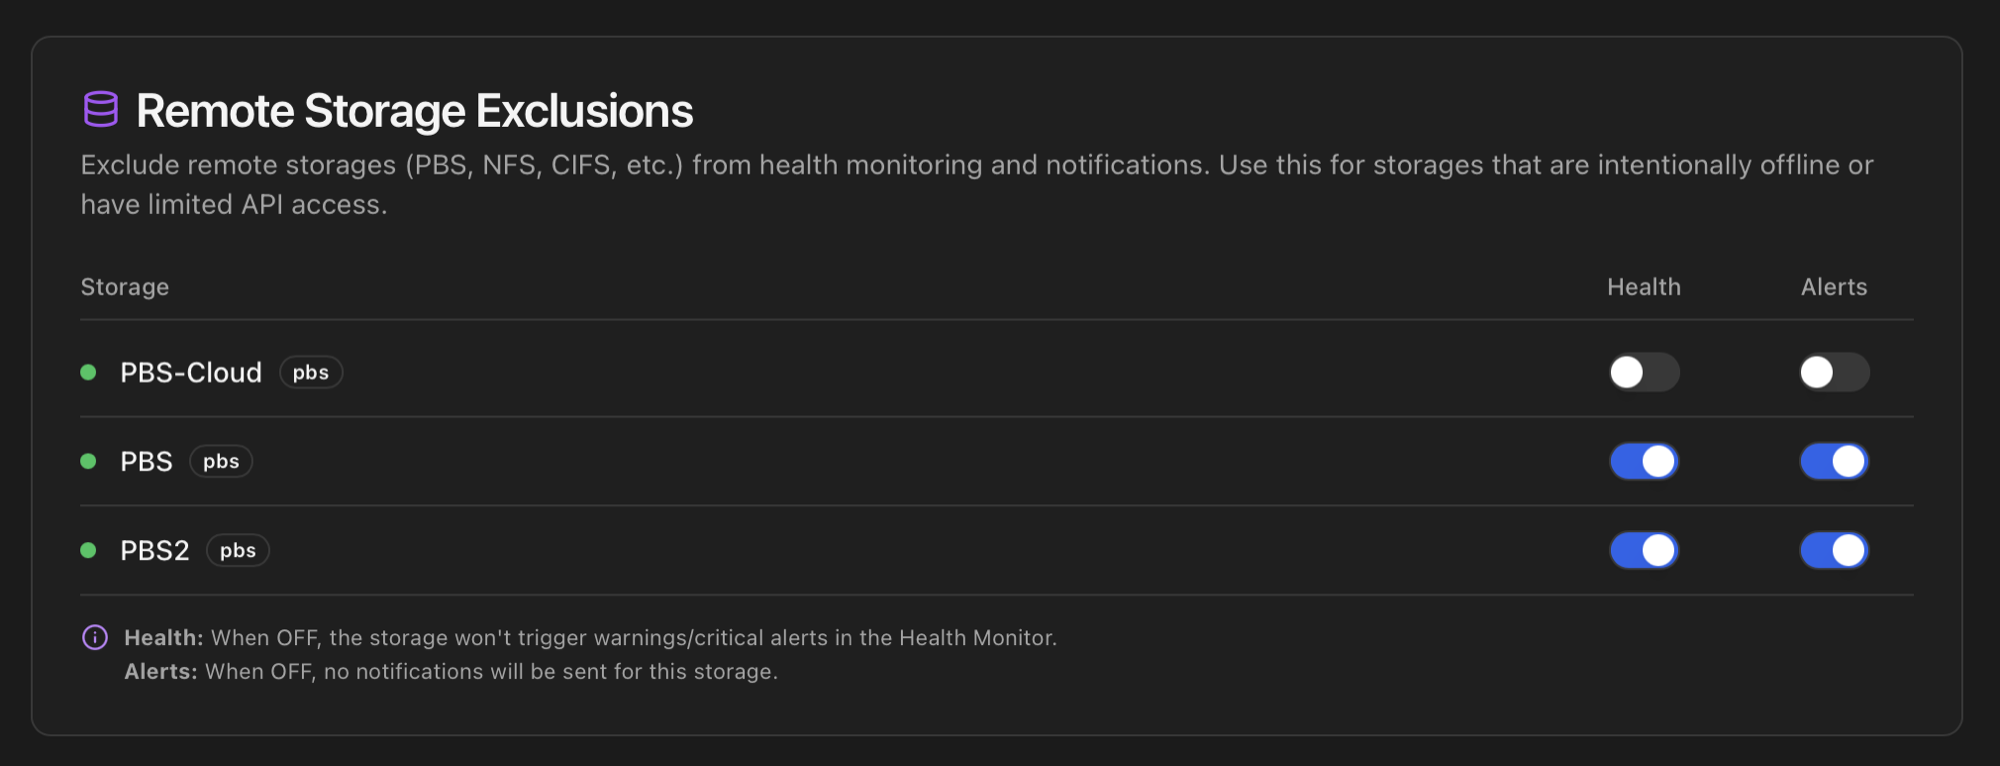
Mark Proxmox-managed storages (NFS / CIFS / PBS / Ceph / iSCSI / etc.) as excluded from monitoring. Two independent toggles per storage:
- Health — when off, the storage stops contributing to the Storage category of the Health Monitor. Useful for archive volumes that are intentionally offline most of the time or remote backup targets only powered up on schedule.
- Alerts — when off, alerts about this storage no longer go out through configured channels, even if Health checks remain enabled. Useful when you want the dashboard view but not the notifications.
Excluded storages still render on the Storage tab with a purple excluded badge so the entry doesn't silently disappear from your inventory. State is persisted in the excluded_storages SQLite table.
Network Interface Exclusions
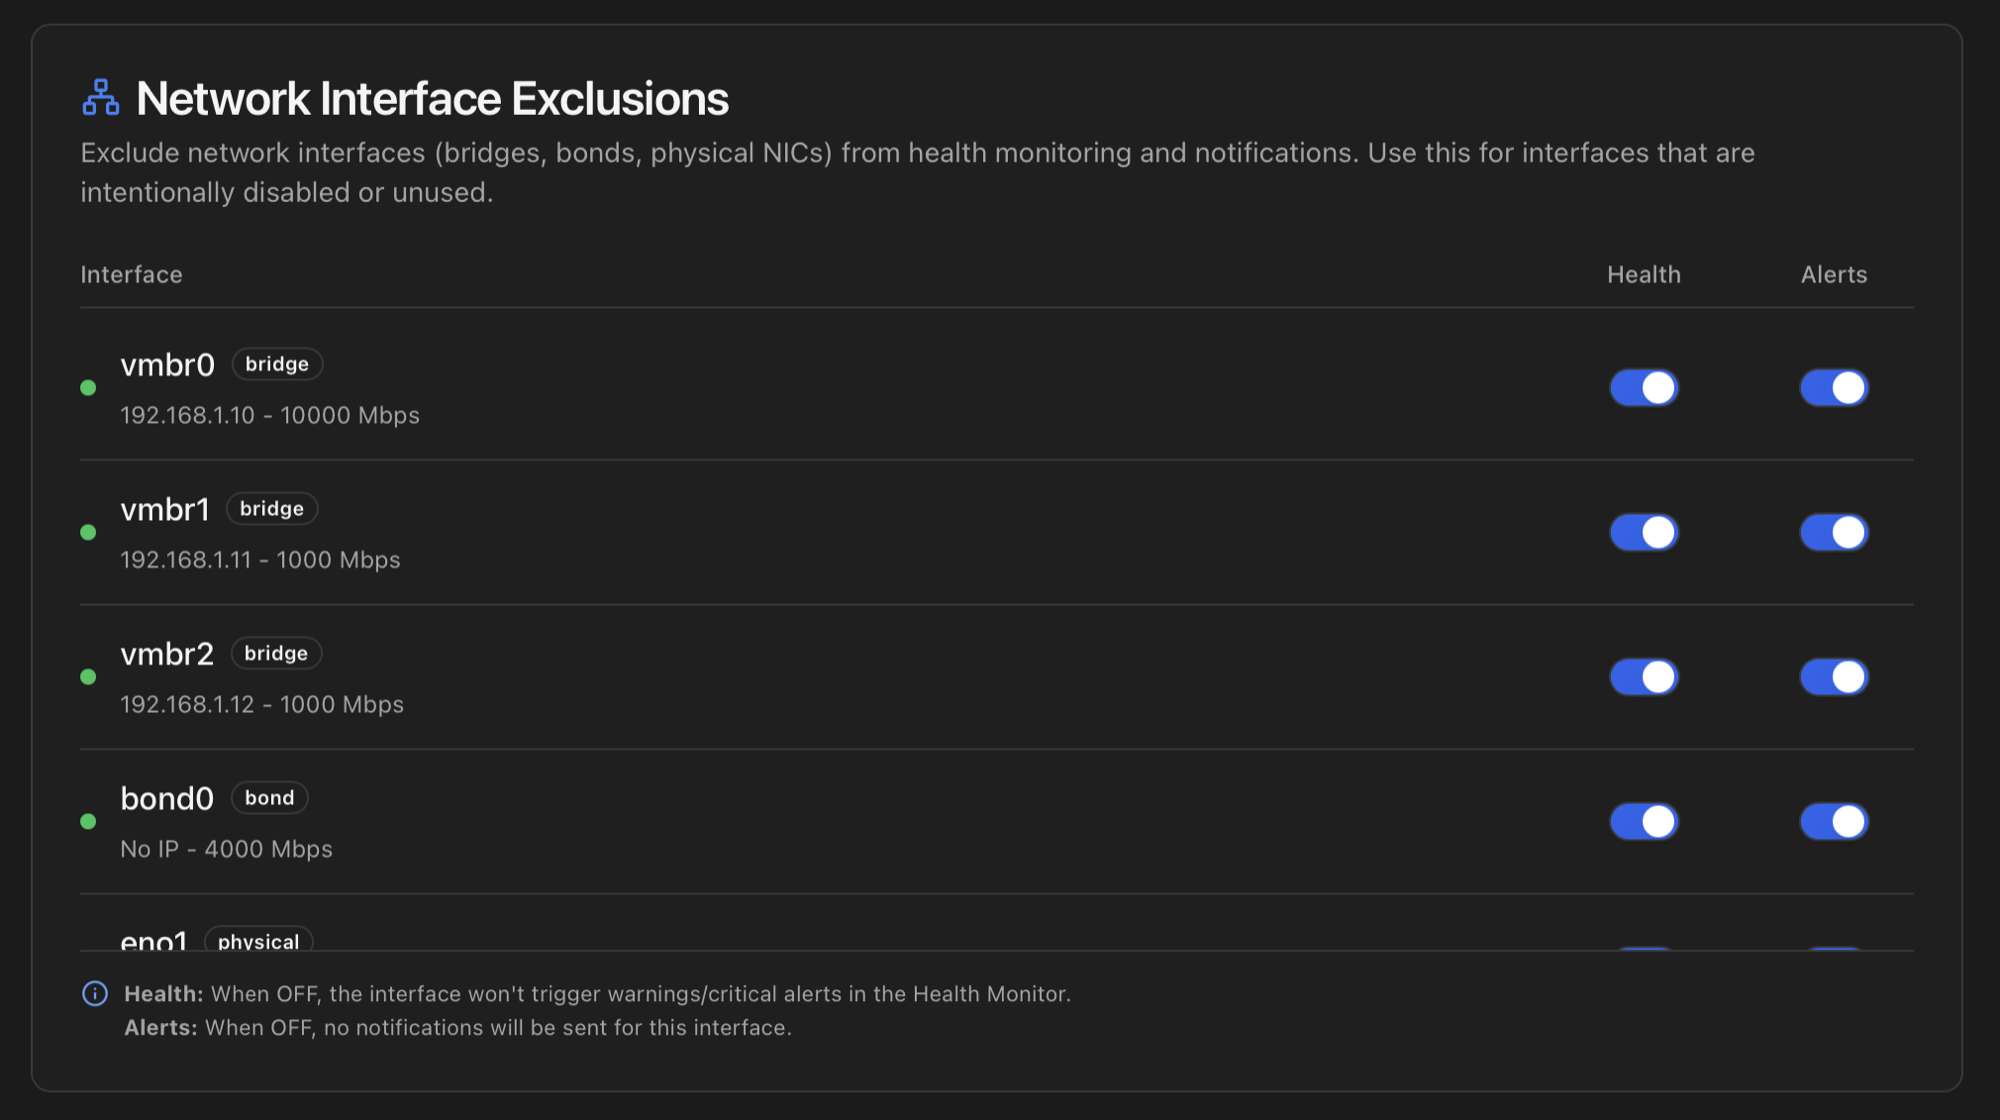
Same shape as Storage Exclusions but for network interfaces. Per interface: exclude from Health checks and / or exclude from notifications. Typical use cases:
- An intentionally-down spare bridge.
- A NIC that was physically removed but still references in
/etc/network/interfaces. - A VLAN sub-interface used only during maintenance windows.
- A management bridge that is up but doesn't carry traffic — flapping noisily on every cycle.
State is persisted in the excluded_interfaces SQLite table. Same purple excluded badge on the Network tab so excluded interfaces stay visible.
Notifications & AI
This section of the Settings tab is where ProxMenux Monitor notifications and the AI rewriter are turned on. Pressing Enable Notifications starts the dispatch background thread, registers a Proxmox VE webhook target on the host so PVE-emitted events flow into the same pipeline, and unfolds the channel form so you can connect Telegram, Discord, Email, Gotify and the rest. The AI rewriter sits inside the same panel as a collapsible advanced section.
Both surfaces have a lot of moving parts — channels, per-event toggles, Rich messages, the Display Name, the dispatch pipeline (dedup, cooldown, aggregation, quiet hours), the PVE webhook integration, AI providers, prompt modes — and live on their own dedicated pages rather than being repeated here:
- Notifications — channel walk-throughs (Telegram, Discord, Gotify, Email + Gmail / Microsoft app passwords, ntfy, Slack, Teams, generic webhook), per-event categories, Rich messages, Display Name, dispatch pipeline, PVE webhook integration, history and API.
- AI Assistant — providers (OpenAI, Anthropic, Gemini, Groq, OpenRouter, Ollama), model selection, prompt modes (default / custom), output language, per-channel detail levels and AI suggestions.
ProxMenux Optimizations
A live, transparent inventory of every ProxMenux post-install optimization currently active on the host. Every time you apply a post-install option from the Scripts side — either via the Automated post-install or via the à-la-carte Customizable post-install — the corresponding script registers itself in /usr/local/share/proxmenux/installed_tools.json. The Monitor reads that file and renders this card so you can see, at a glance, what's been changed on your server.
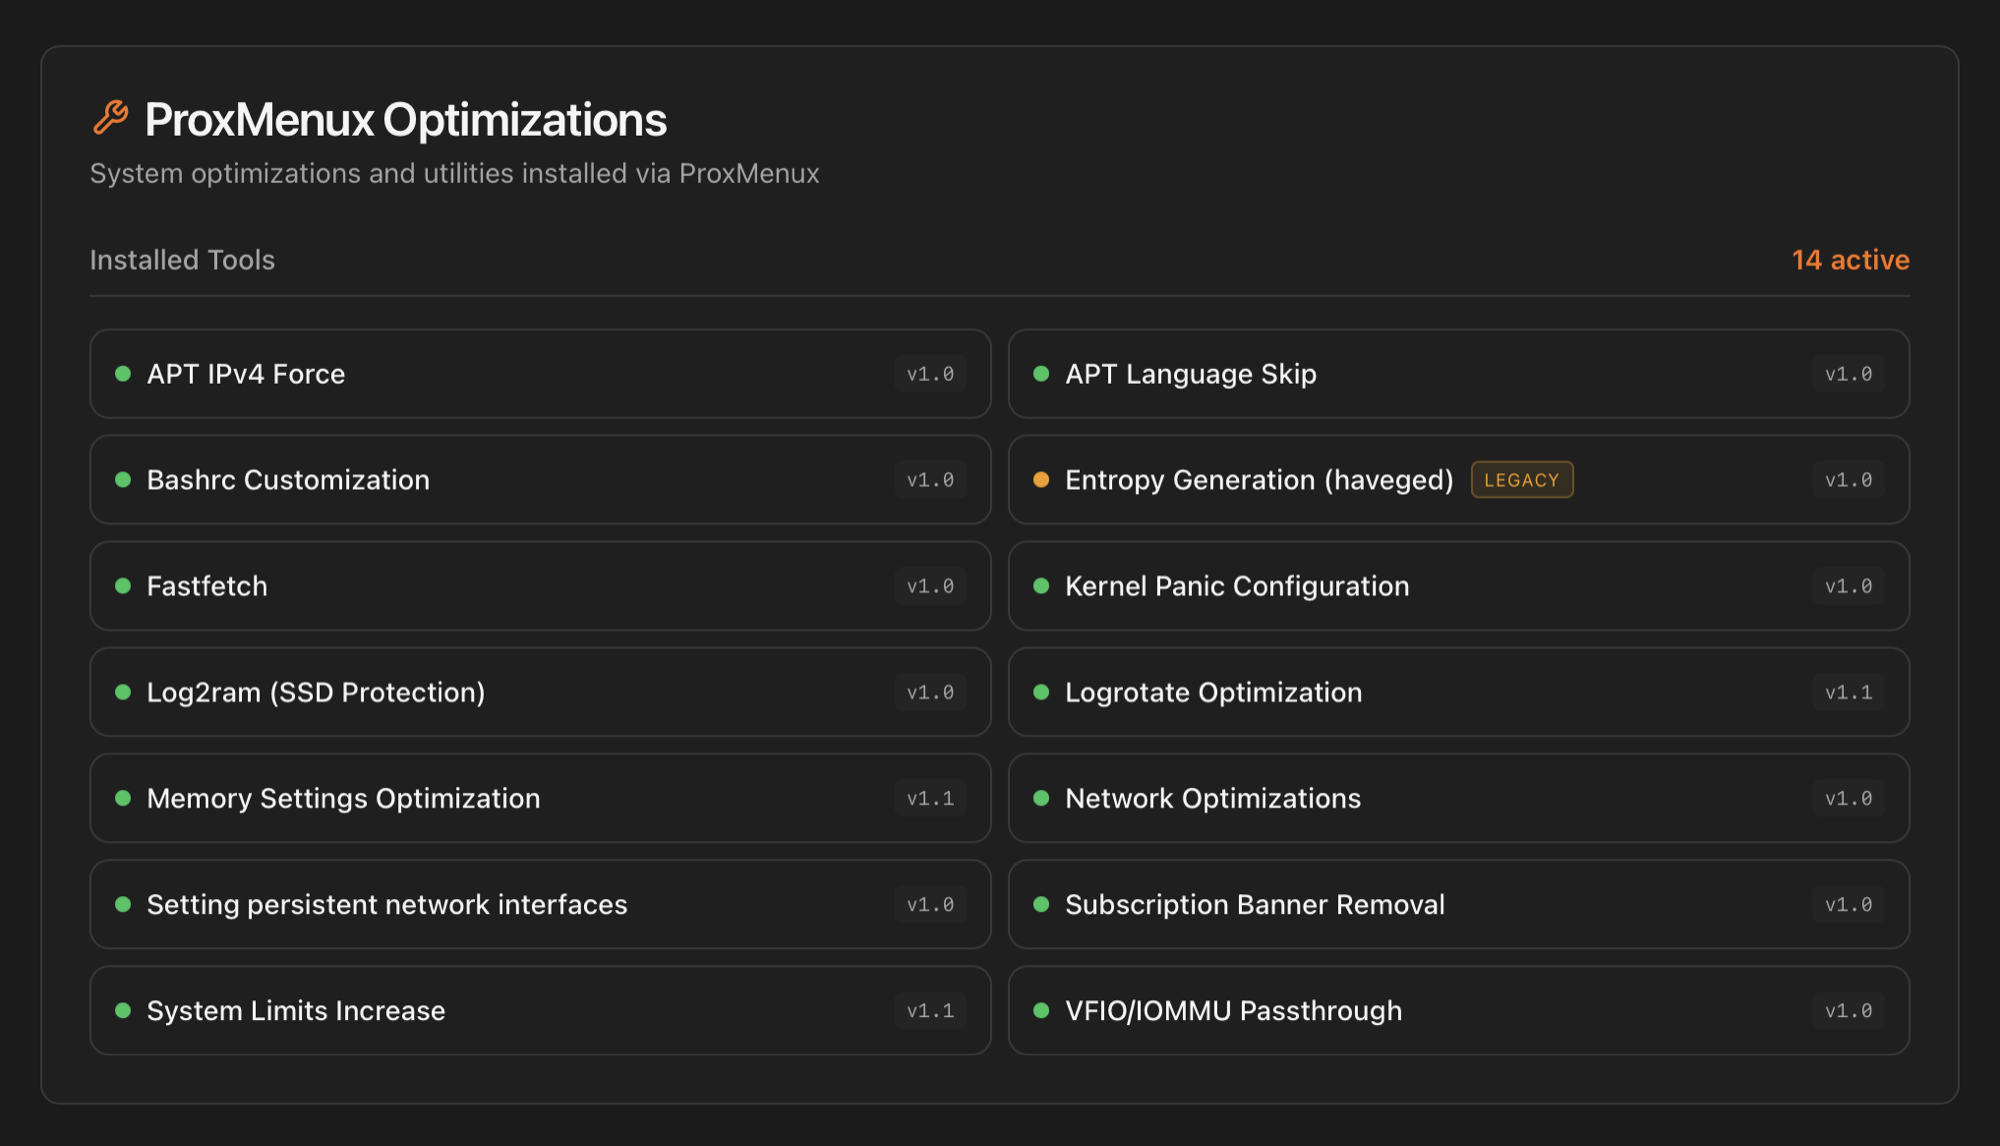
What the dots mean
- <green/> Green dot — current optimization, registered by the active version of ProxMenux. Source code is reachable: click the row to open it.
- <amber/> Amber dot + legacy badge — applied by an older ProxMenux version whose script has since been renamed or replaced. Still active on the host; the source opens in "legacy" mode (with an amber accent) so you can audit what was actually run.
Click-through to source code
Clicking a tool opens a modal with the exact bash function that applied the change, plus the script file path it lives in (auto_post_install.sh for the Automated bundle, customizable_post_install.sh for the à-la-carte side). Comments and shell constructs are syntax-highlighted; a Copy button puts the source on your clipboard. This is the "show your work" surface — verify what ProxMenux did to your host before any manual change you make on top.
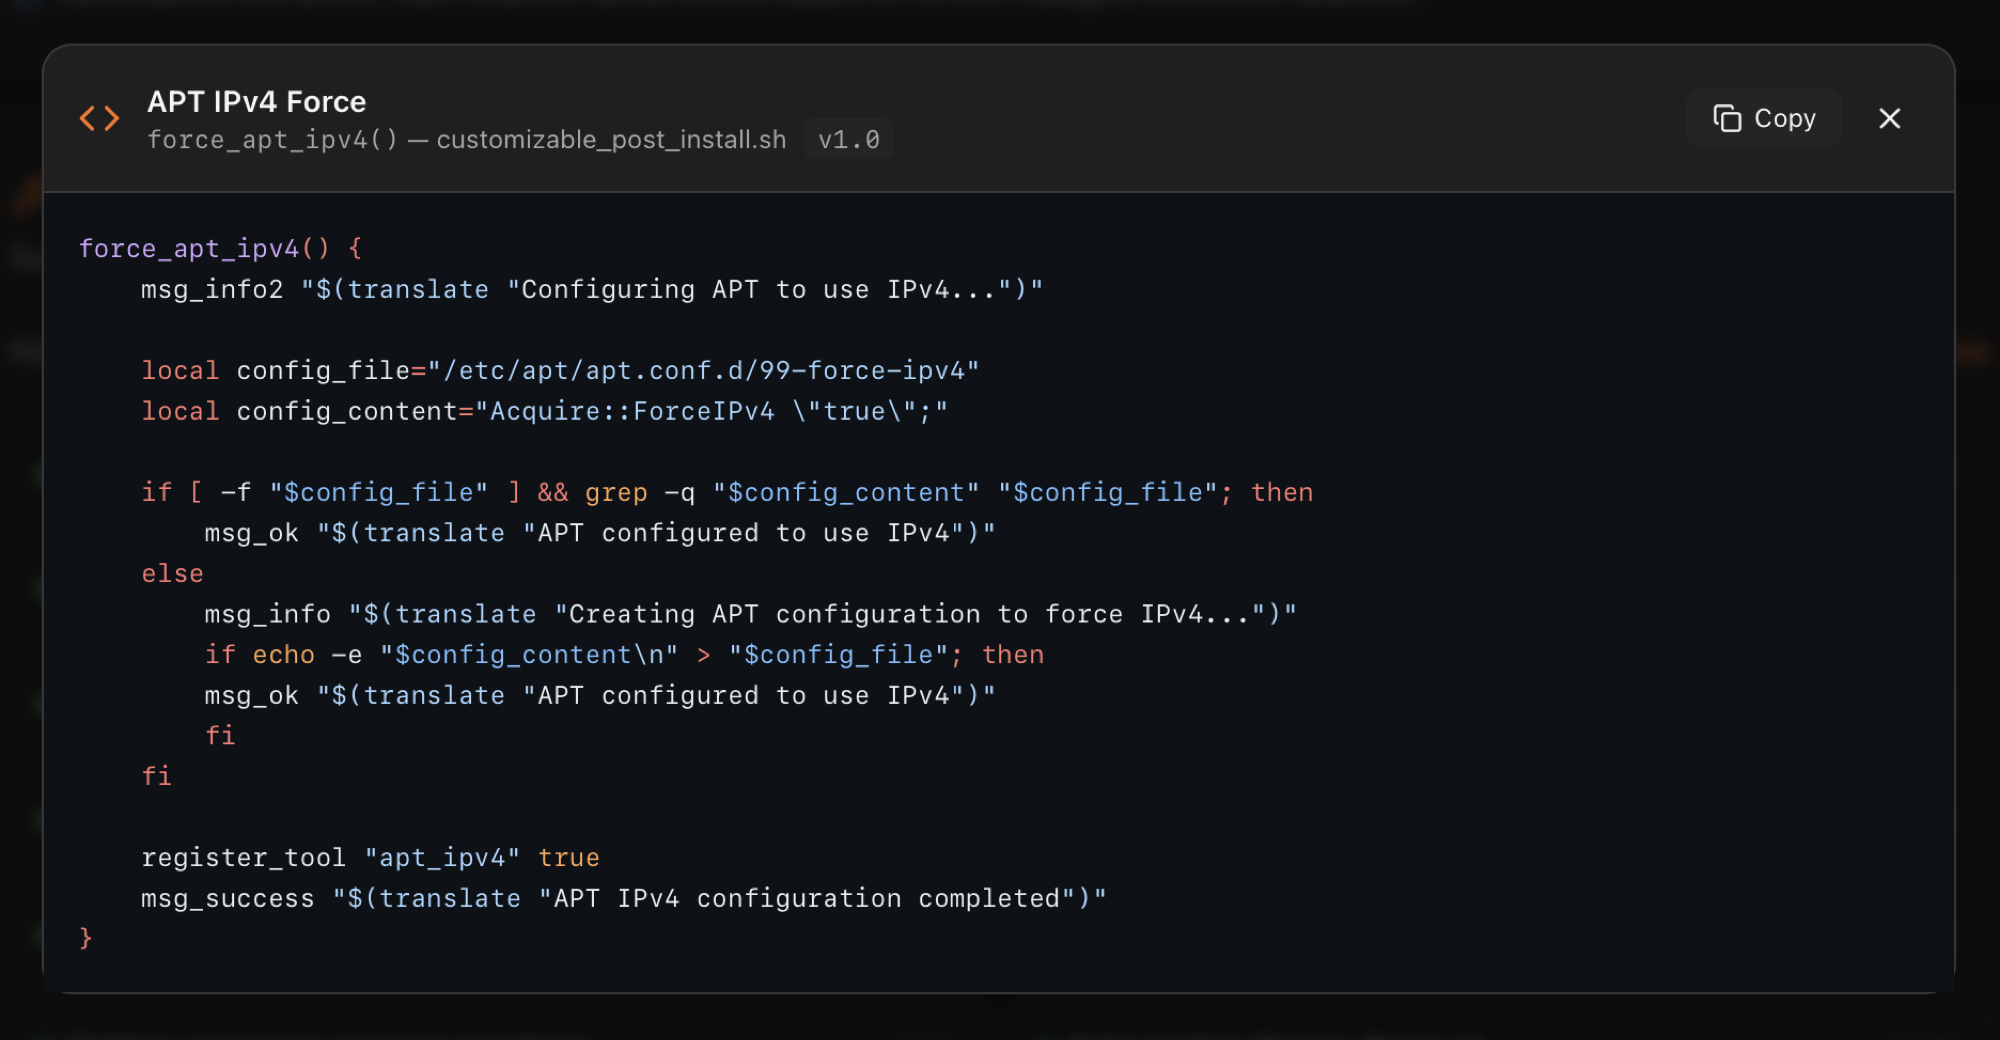
force_apt_ipv4() function from customizable_post_install.sh v1.0, with syntax highlighting and a one-click Copy.Why this matters
Updates available banner
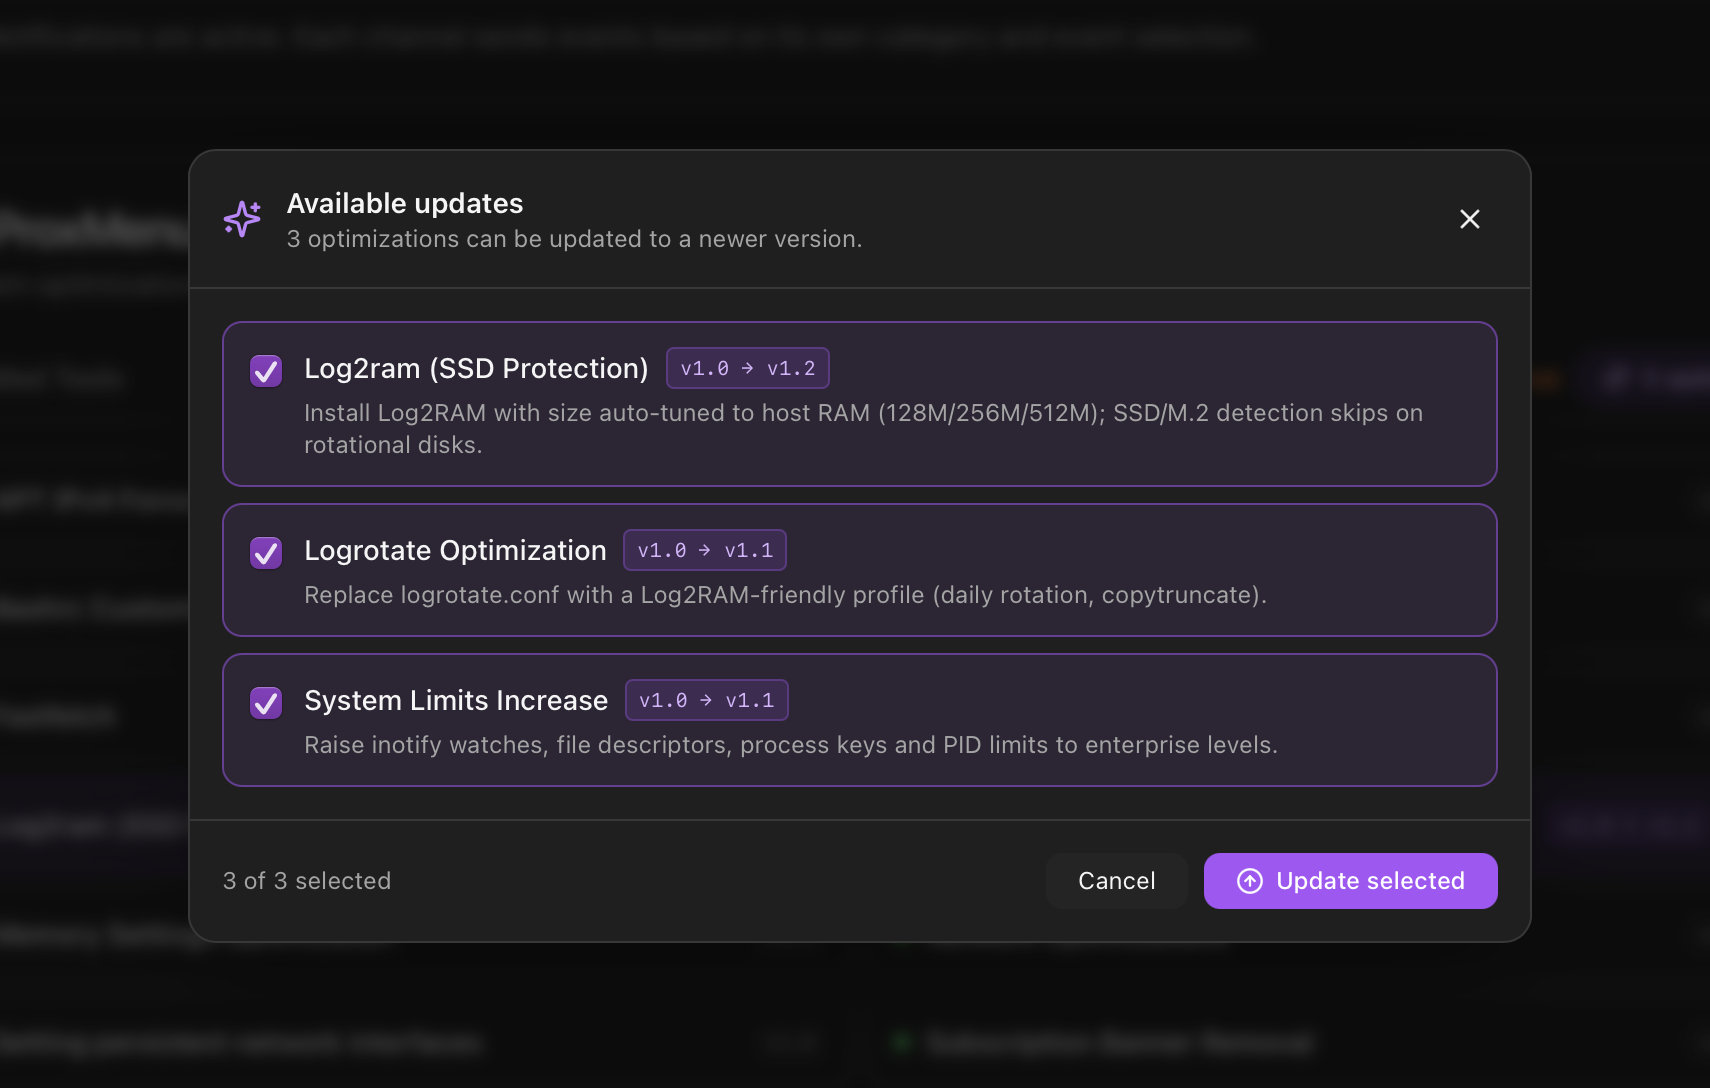
When a post-install optimization gets a newer version on disk than the one currently registered on the host, the card shows an "Updates available" banner at the top with the count and an Apply button. Clicking Apply opens a per-optimization picker (the same one available from the Post-Install menu's Apply available updates entry). Pick which optimizations to lift; ProxMenux re-runs the corresponding function and refreshes the version in the registry. When everything is current the banner disappears.
Reverting an optimization
The card is read-only — to undo an optimization, run the corresponding Uninstall Optimizations option from the ProxMenux Scripts menu. The uninstall step removes the entry from installed_tools.json, so it disappears from this card on the next refresh.
How the data is collected
| Card | Endpoint | Source |
|---|---|---|
| Network Units | /api/settings | Persisted in the dashboard's SQLite settings table. |
| Health Monitor durations | /api/health/settings | Per-category suppression durations in the Health DB. |
| Storage / interface exclusions | /api/storage/exclusions, /api/network/exclusions | SQLite tables excluded_storages and excluded_interfaces. |
| Notifications & AI panel | /api/notifications/* | See the dedicated Notifications / AI Assistant pages. |
| ProxMenux Optimizations list | /api/proxmenux/installed-tools | Reads /usr/local/share/proxmenux/installed_tools.json, written by register_tool calls inside the post-install scripts. |
| Optimization source-code modal | /api/proxmenux/tool-source | Extracts the matching bash function from auto_post_install.sh or customizable_post_install.sh on the host. |
Where to next
- Notifications — channels, per-event toggles, channel overrides, history, test-send.
- AI Assistant — providers, models, prompt modes, languages, per-channel detail levels.
- Health Monitor → Dismissing alerts and the Suppression Duration — the semantics behind the per-category dropdowns above.
- ProxMenux Scripts → Automated post-install and Customizable post-install — the actual scripts that register themselves in the optimization list above.
- Uninstall Optimizations — how to revert an optimization registered above.
- Dashboard index — back to the tab overview.