Dashboard: Hardware tab
The physical machine in one screen — CPU and motherboard identity, every memory module, thermal sensors across all subsystems, GPUs with live utilisation and a built-in driver installer, Coral TPUs, every PCI and USB device with its kernel driver, the full disk inventory with negotiated link speeds, plus power, cooling and the UPS.
Built from standard tools
lscpu, dmidecode, lspci, lsusb, lsblk, smartctl, nvme, sensors, nvidia-smi, intel_gpu_top, amdgpu_top, ipmitool and upsc. Sections only render when the relevant tool returns data, so a host without a UPS won't show the UPS card and a host without IPMI won't show out-of-band power figures.Status colours and thresholds applied here
- CPU temperature — Warning 80 °C, Critical 90 °C.
- Disk temperature — HDD 60/65 °C · SSD 70/75 °C · NVMe 80/85 °C · SAS 55/65 °C (warning / critical).
Sections
The tab renders top-to-bottom in this order. Some sections only appear when the host has the corresponding hardware or tool installed — they're marked (conditional) below.
System Information
Two side-by-side blocks, always present:
- CPU — model name, microarchitecture, sockets / cores / threads, base / boost frequency, virtualisation flags (VT-x / AMD-V), cache topology.
- Motherboard — vendor, model, BIOS version, BIOS date, SMBIOS UUID. Useful for matching to vendor download pages when looking for firmware updates.
Memory Modules
One row per populated slot from dmidecode: slot label, module size, type (DDR4 / DDR5 / ECC variants), speed (configured and rated), manufacturer, part number and serial. Empty slots are listed greyed-out so you can see the upgrade headroom at a glance.
Thermal Monitoring
Five sub-blocks, each fed by lm-sensors + tool-specific scrapers. A block hides itself when no sensors are reported in that category.
- CPU — package and per-core temperatures.
- GPU — discrete-GPU sensors via
nvidia-smi/amdgpu_top/ Intel iGPU. Includes hot-spot and memory-junction when the driver exposes them. - NVME — composite + per-sensor temperatures from
nvme. - PCI — sensors that surface as PCI-attached devices (HBAs, network cards with internal sensors).
- OTHER — chipset, VRM, ambient sensors that don't fit elsewhere.
Graphics Cards
Each detected video controller renders as its own card with vendor, model, kind (Integrated / PCI / BMC), PCI slot (BDF), kernel driver and module list. The card also exposes an inline Switch Mode control that flips the GPU between LXC sharing (native driver) and VM passthrough (vfio-pci) — see Switch GPU Mode (VM ↔ LXC) for what happens on the host when you press it.
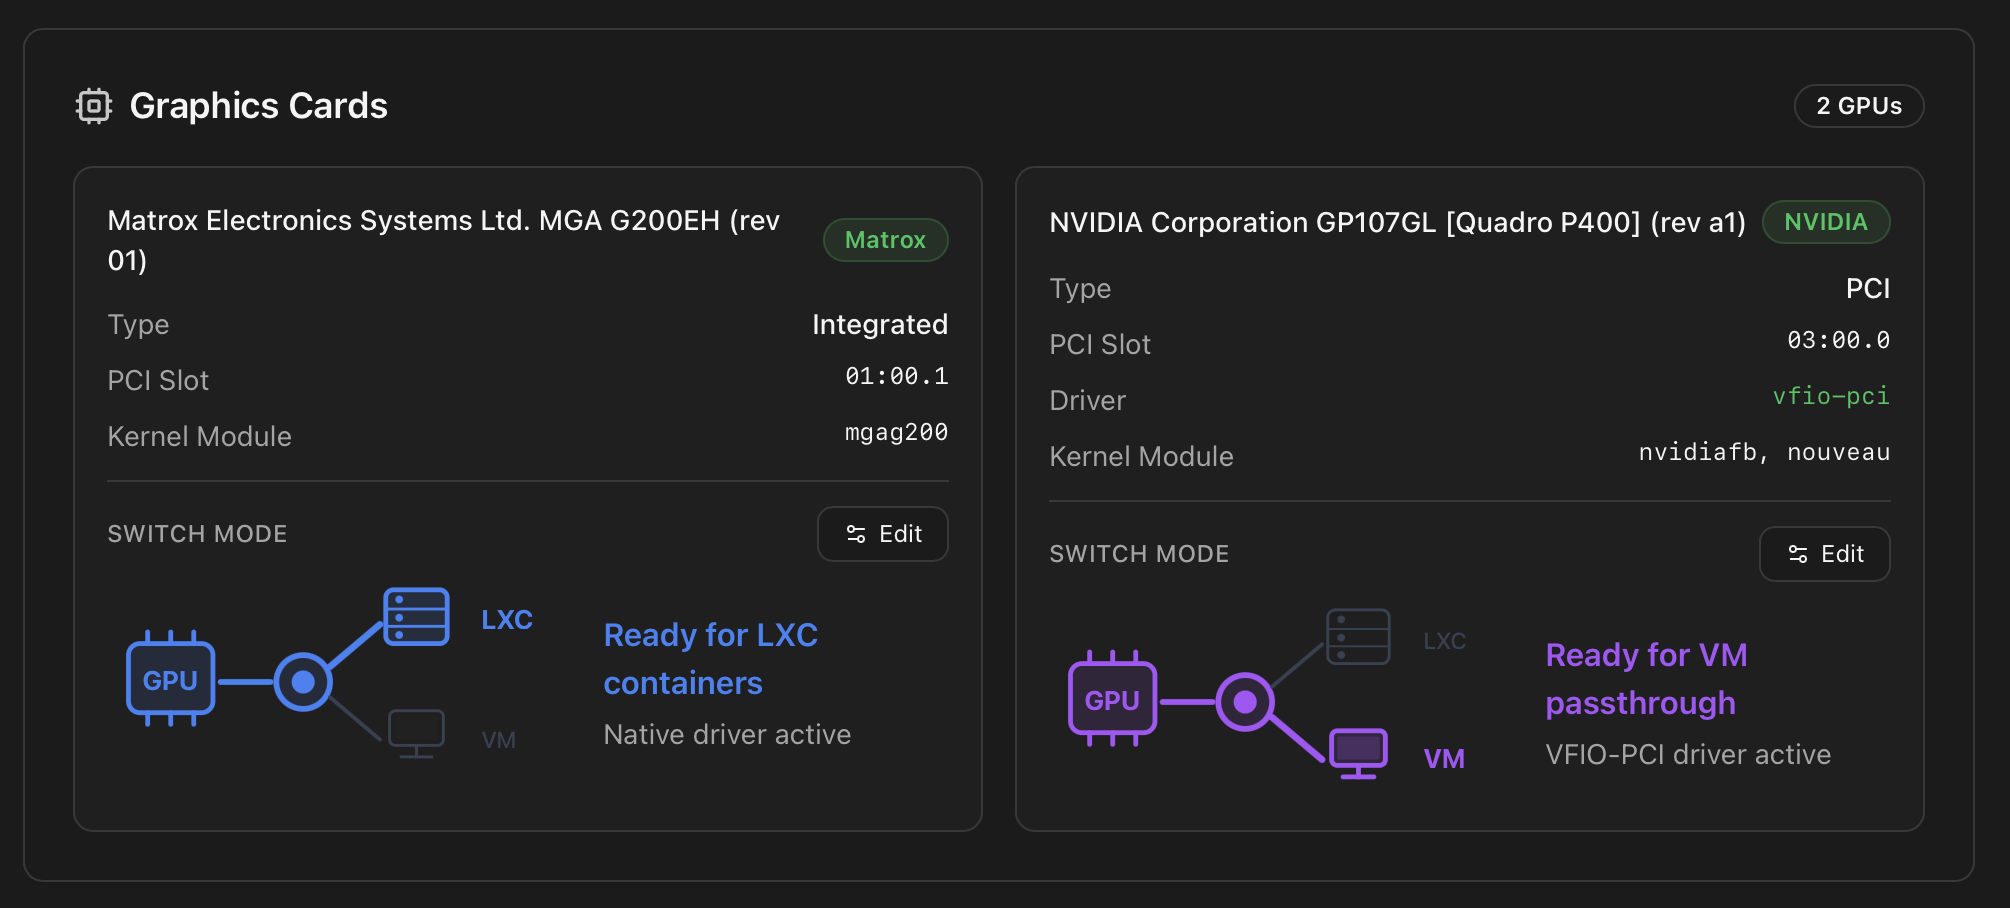
vfio-pci, ready for VM passthrough.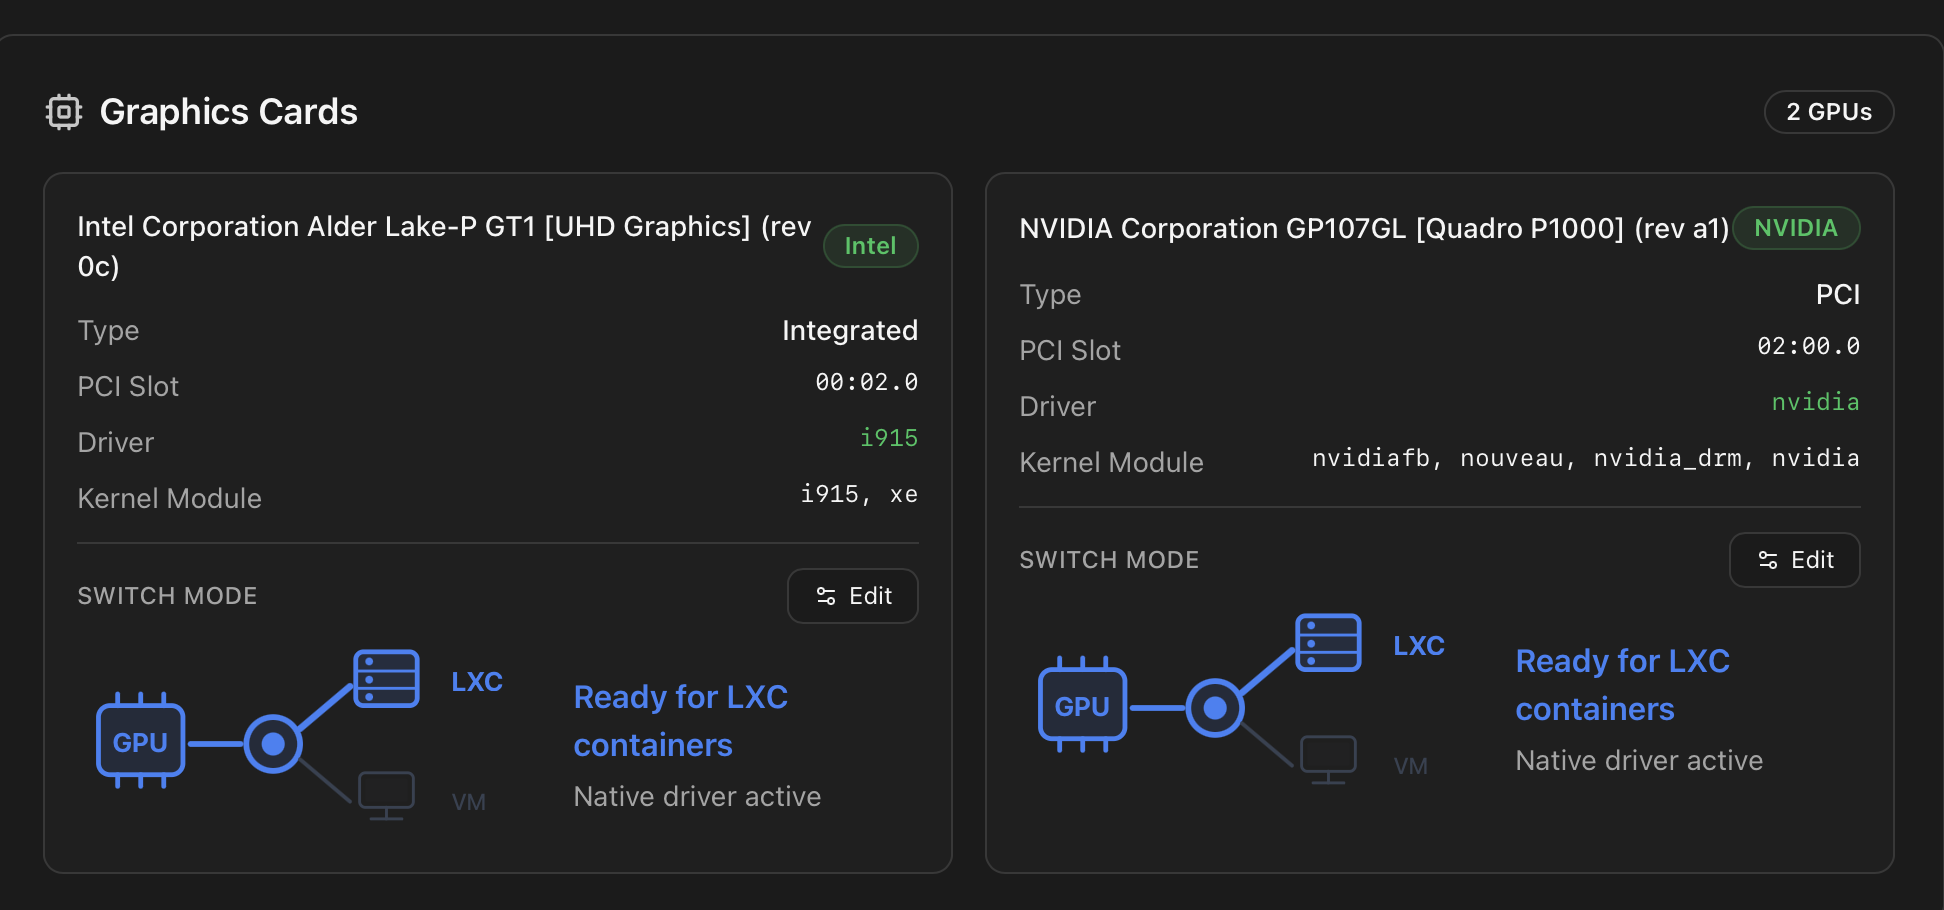
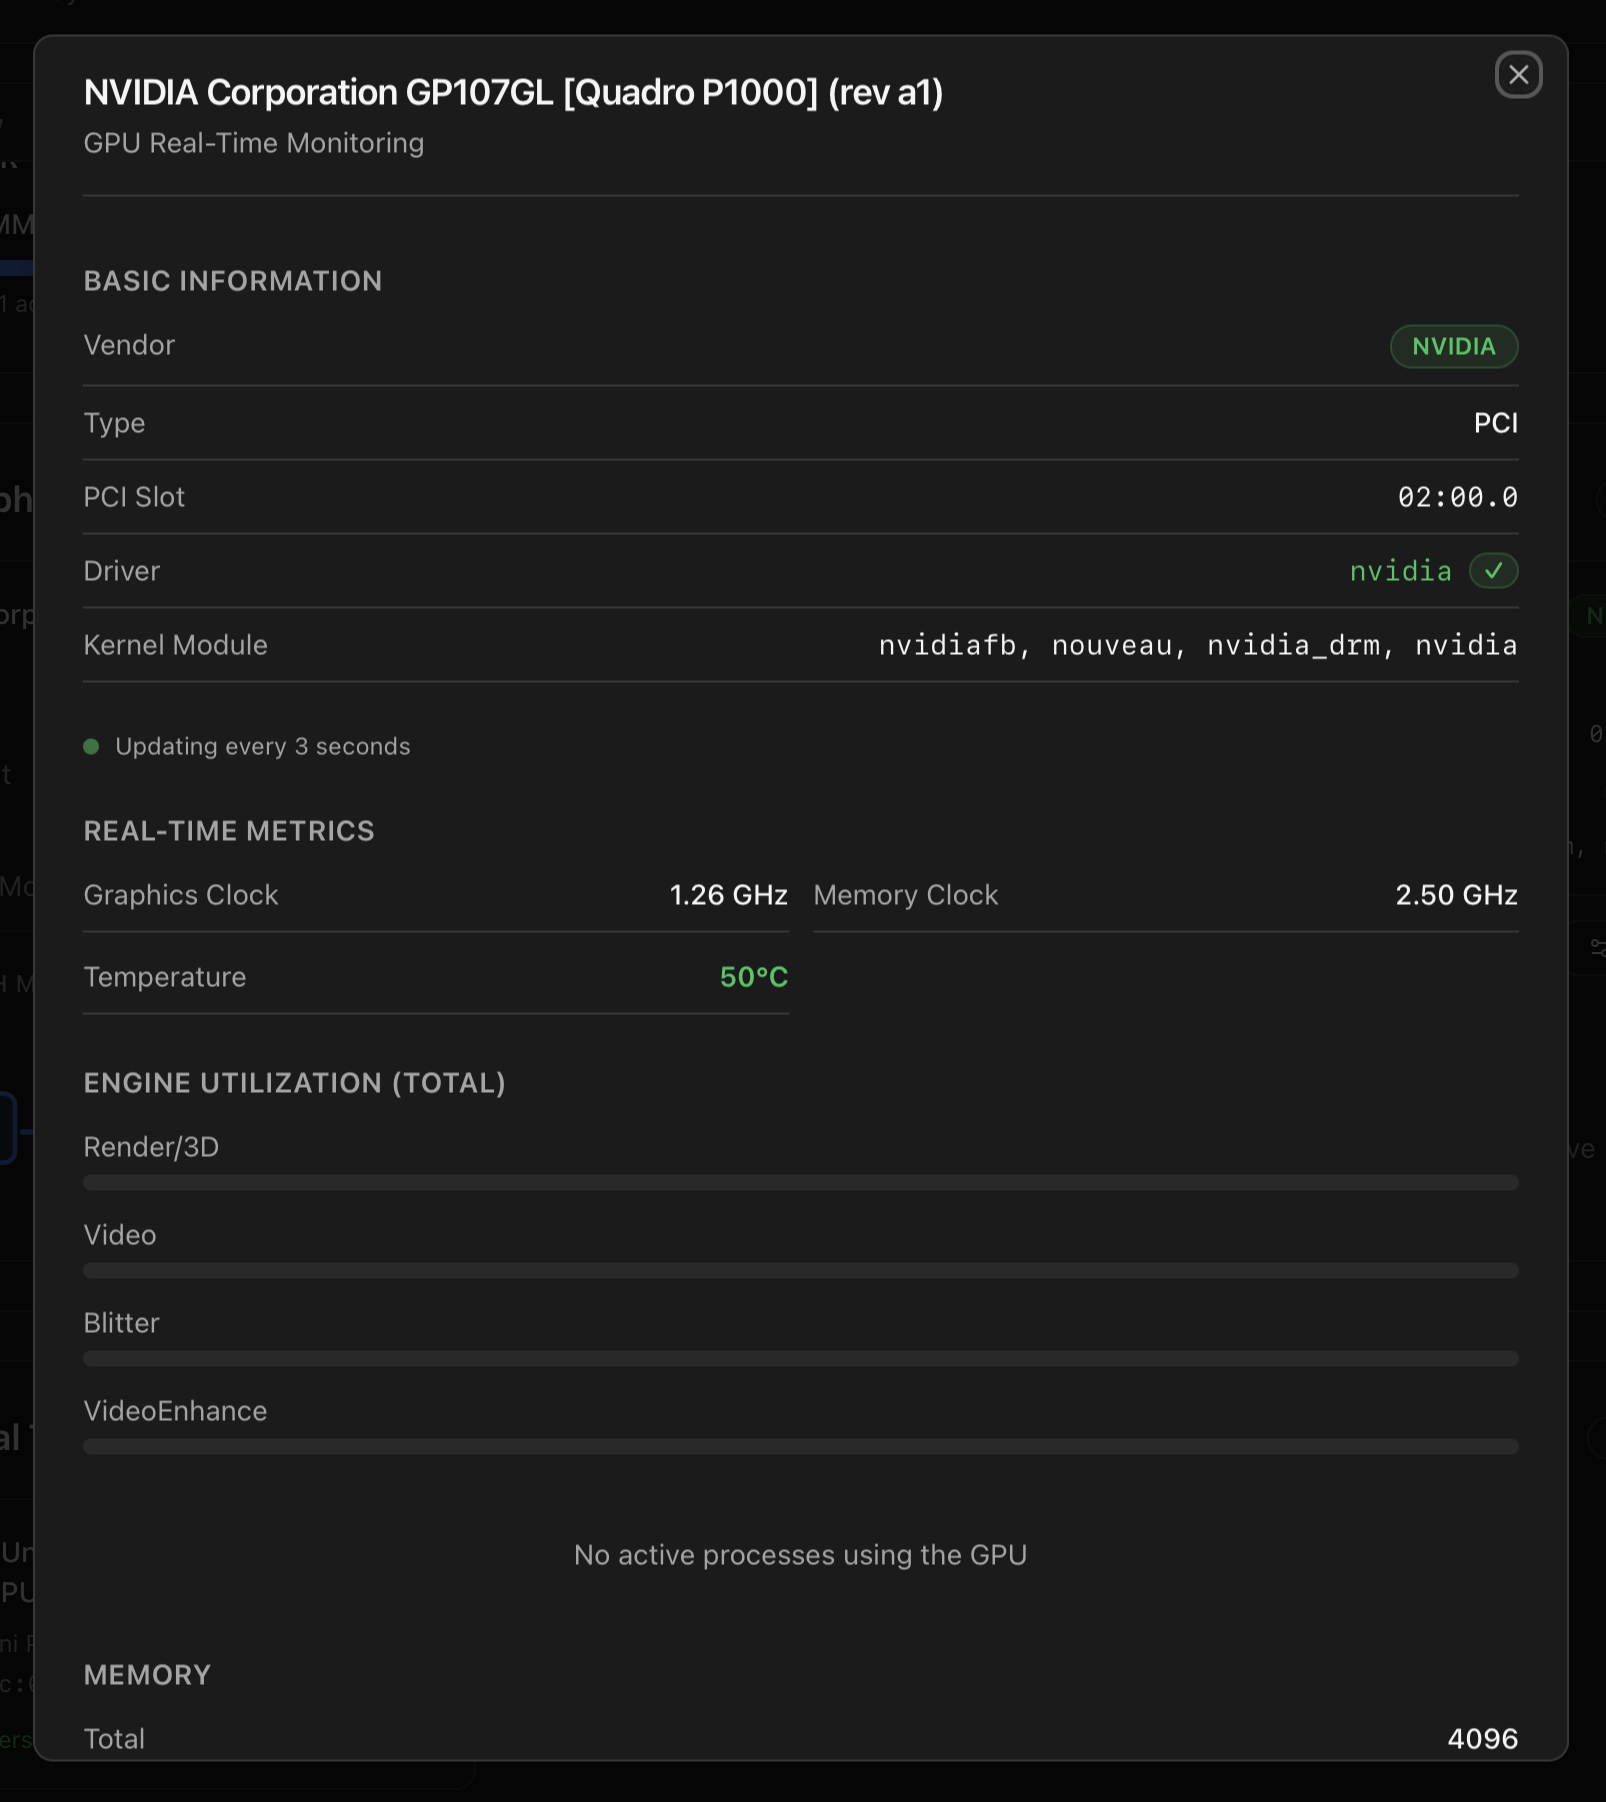
Real-time monitoring modal
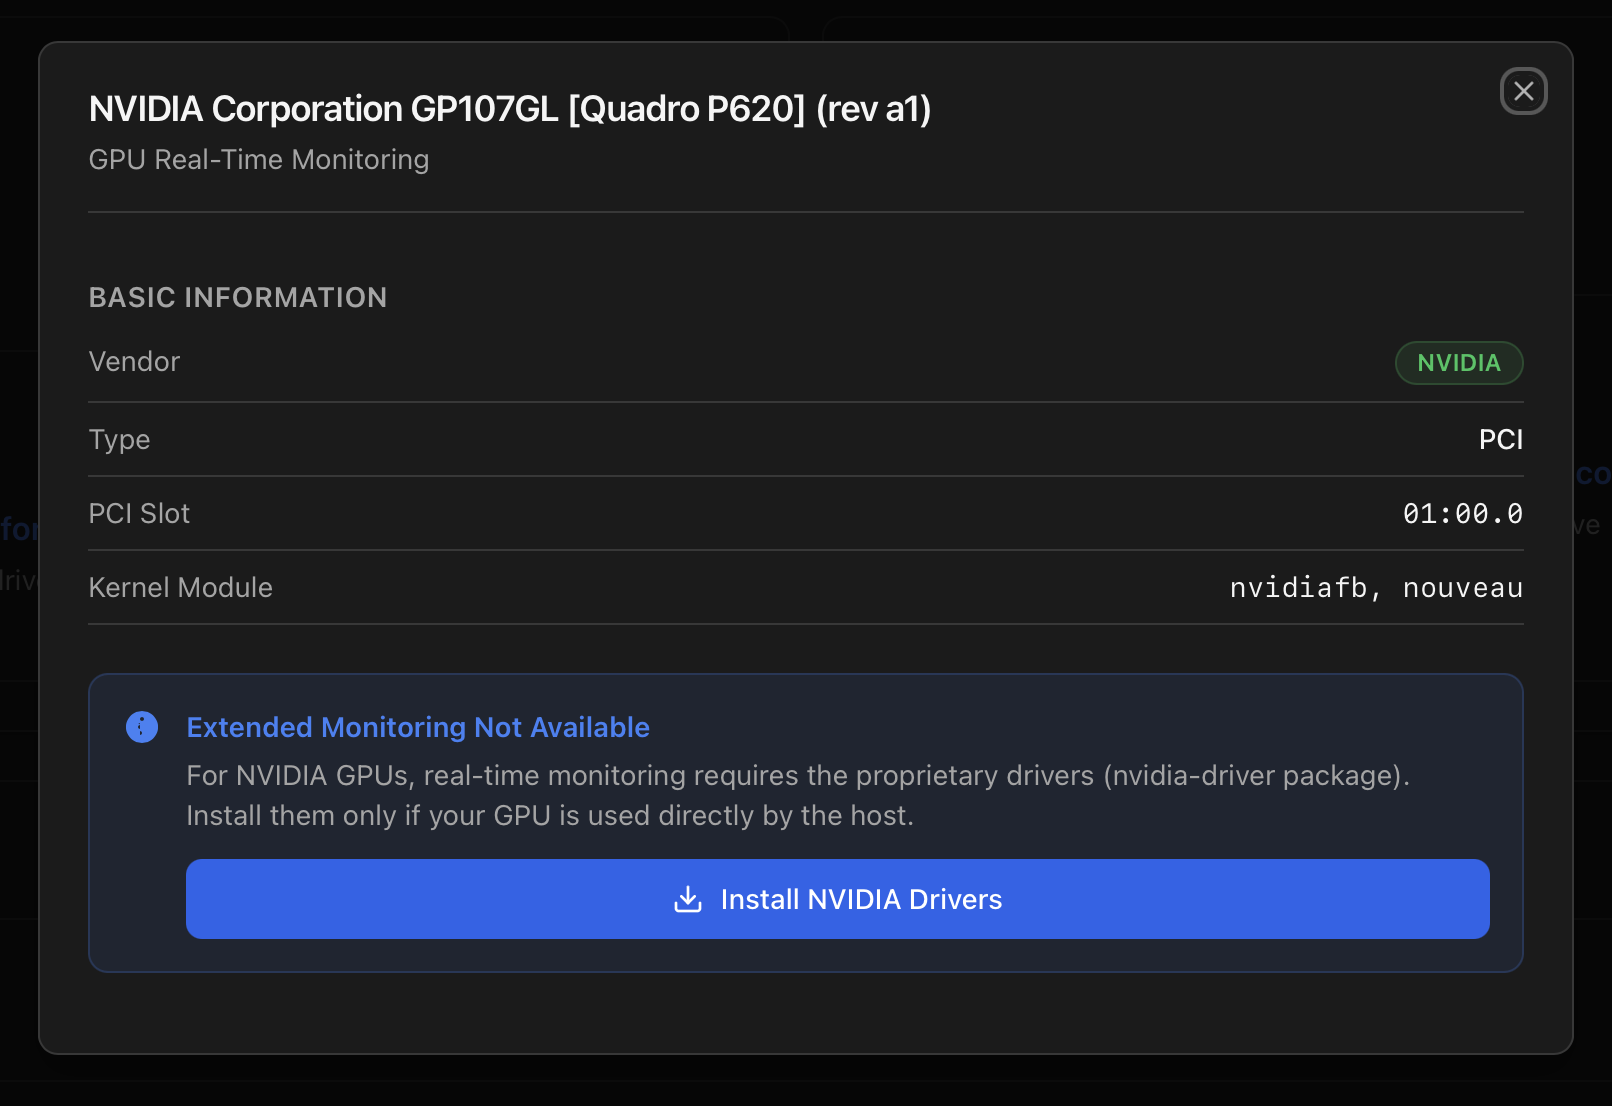
Clicking a GPU card opens a per-slot monitoring modal that polls the appropriate vendor tool every three seconds. The modal exposes vendor, type, PCI slot, driver, kernel module(s), live engine utilisation (Render/3D, Video, Blitter, VideoEnhance), graphics & memory clocks, temperature, power draw (when reported), VRAM usage, and an Active Processes table with per-process engine load. Data is served from /api/gpu/<slot>/realtime.
The vendor tool used per GPU:
| Vendor | Tool | Project |
|---|---|---|
| NVIDIA | nvidia-smi | developer.nvidia.com |
| Intel iGPU | intel_gpu_top (igt-gpu-tools) | gitlab.freedesktop.org |
| AMD | amdgpu_top | github.com/Umio-Yasuno/amdgpu_top |
| Matrox / ASPEED (BMC) | — (display only) | Detected and labelled as BMC; no realtime block. |
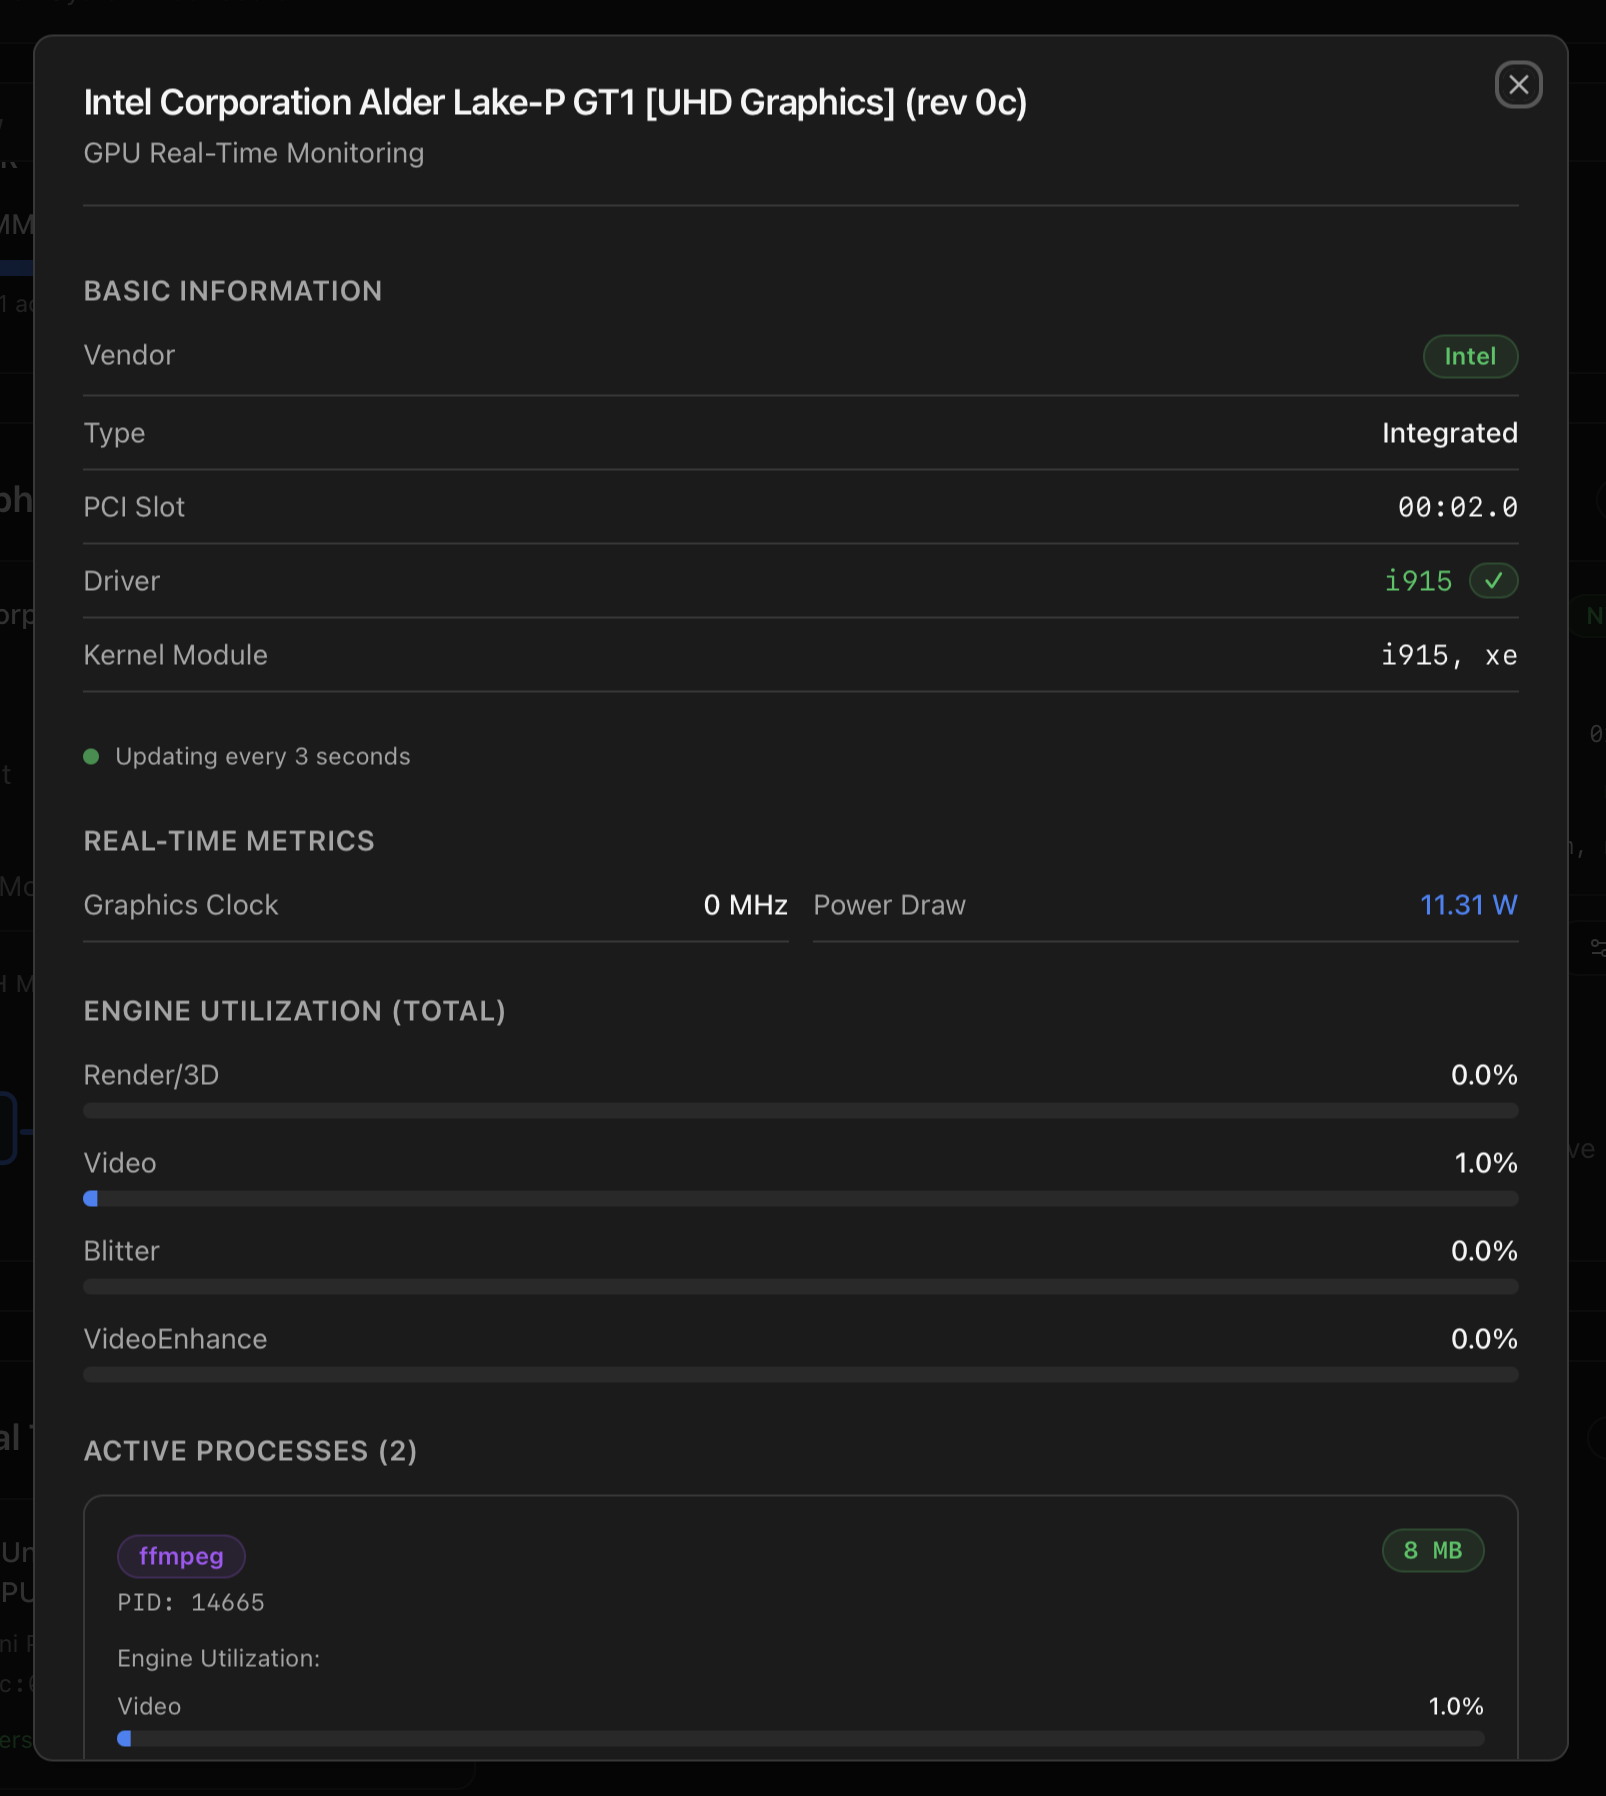
i915 active. The Active Processes table picks up an ffmpeg job using the video engine.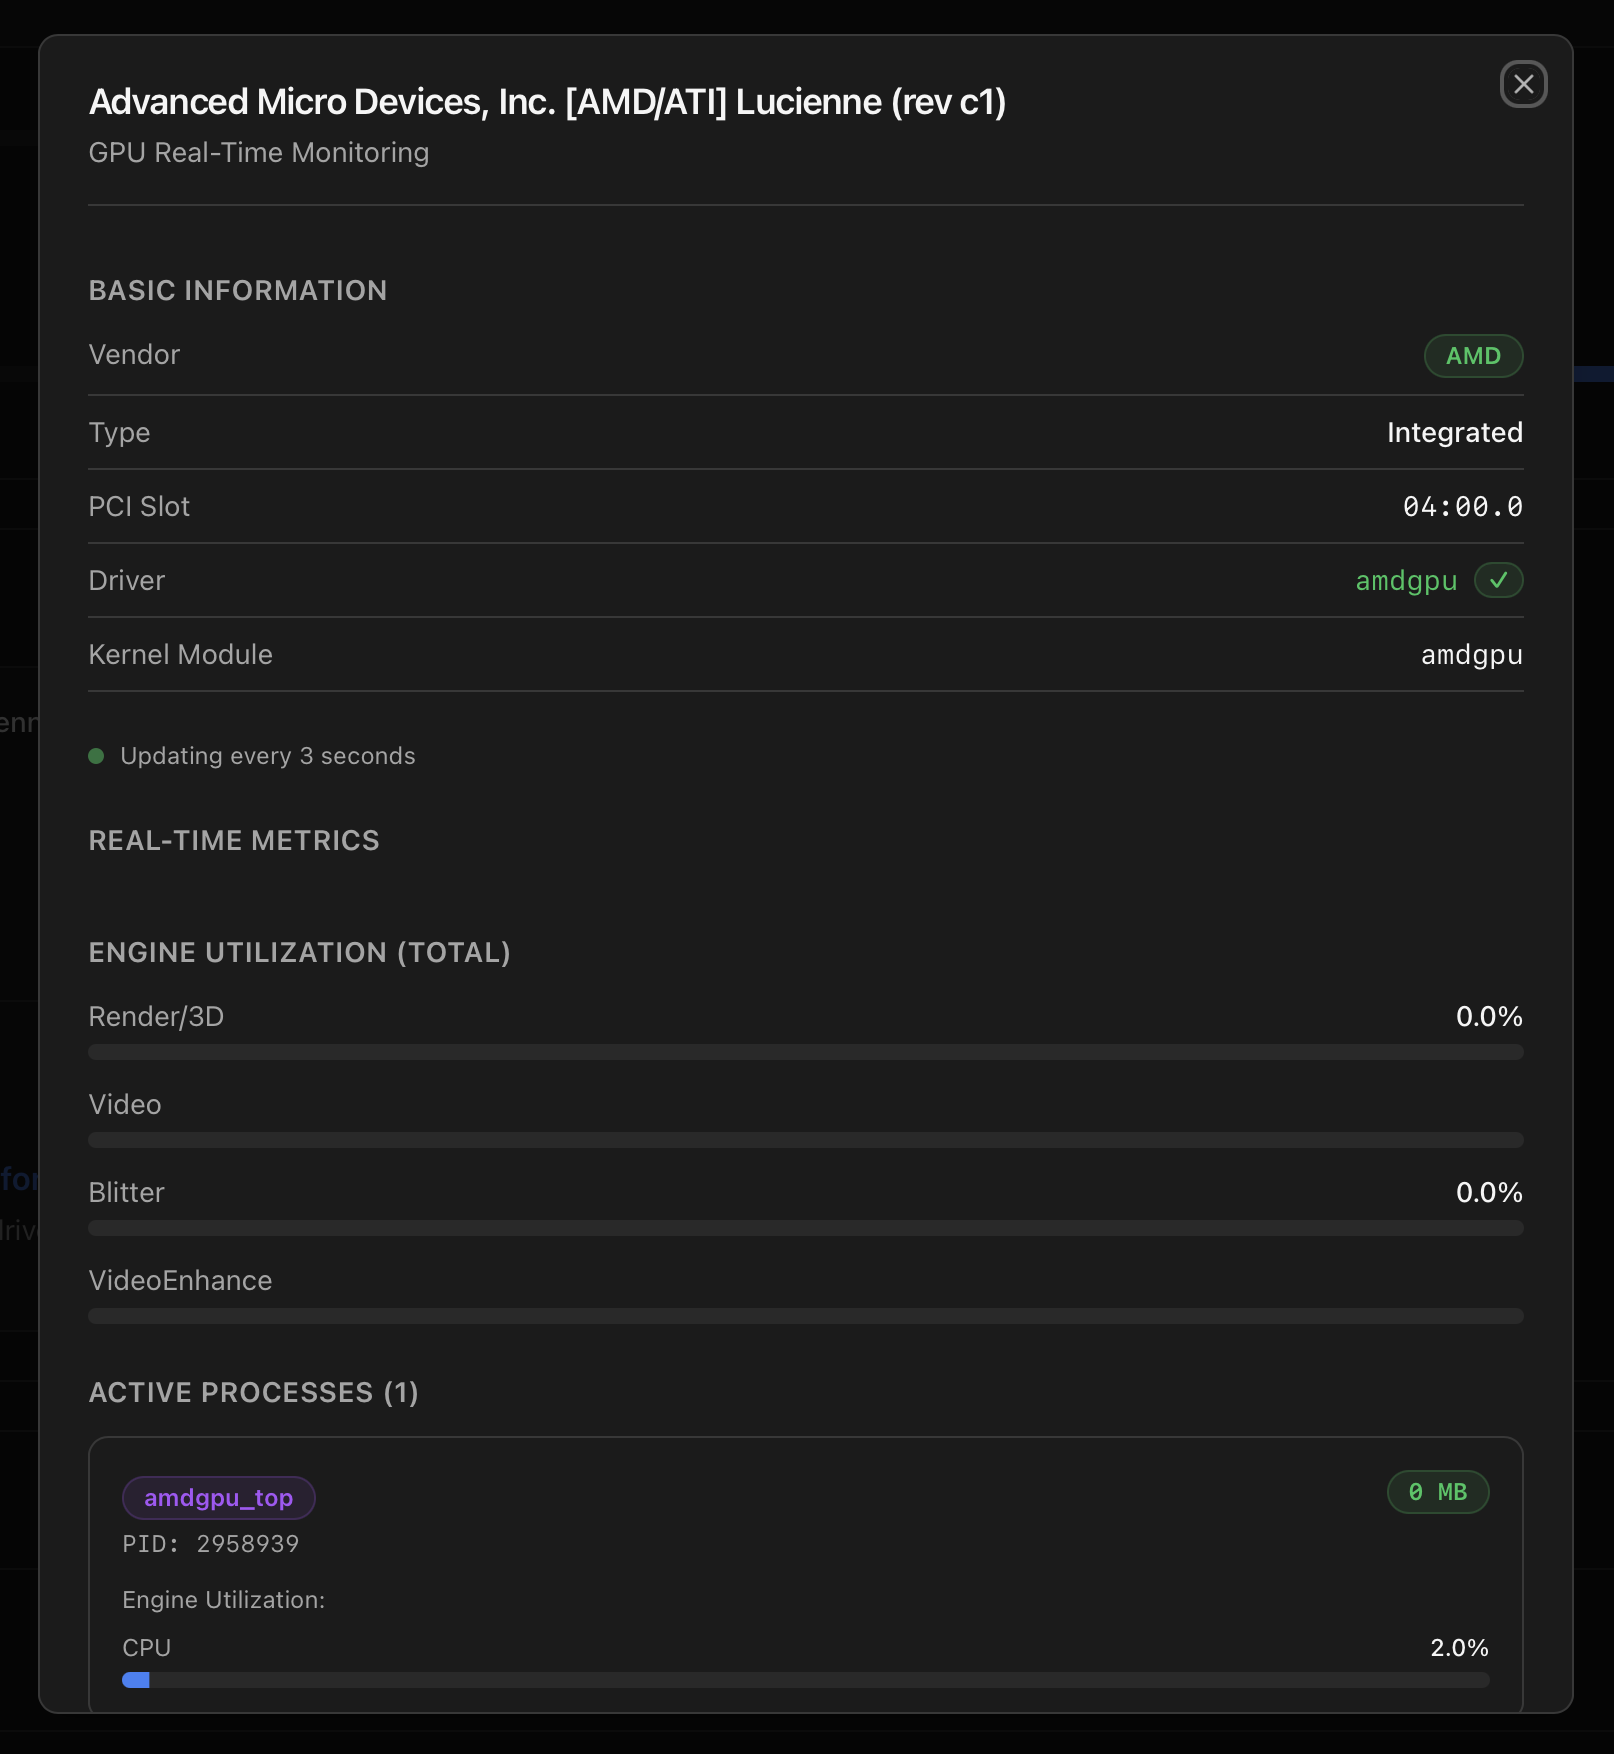
amdgpu_top — the tool itself shows up as an active process because it's the live polling backend.Installing the NVIDIA driver from the modal
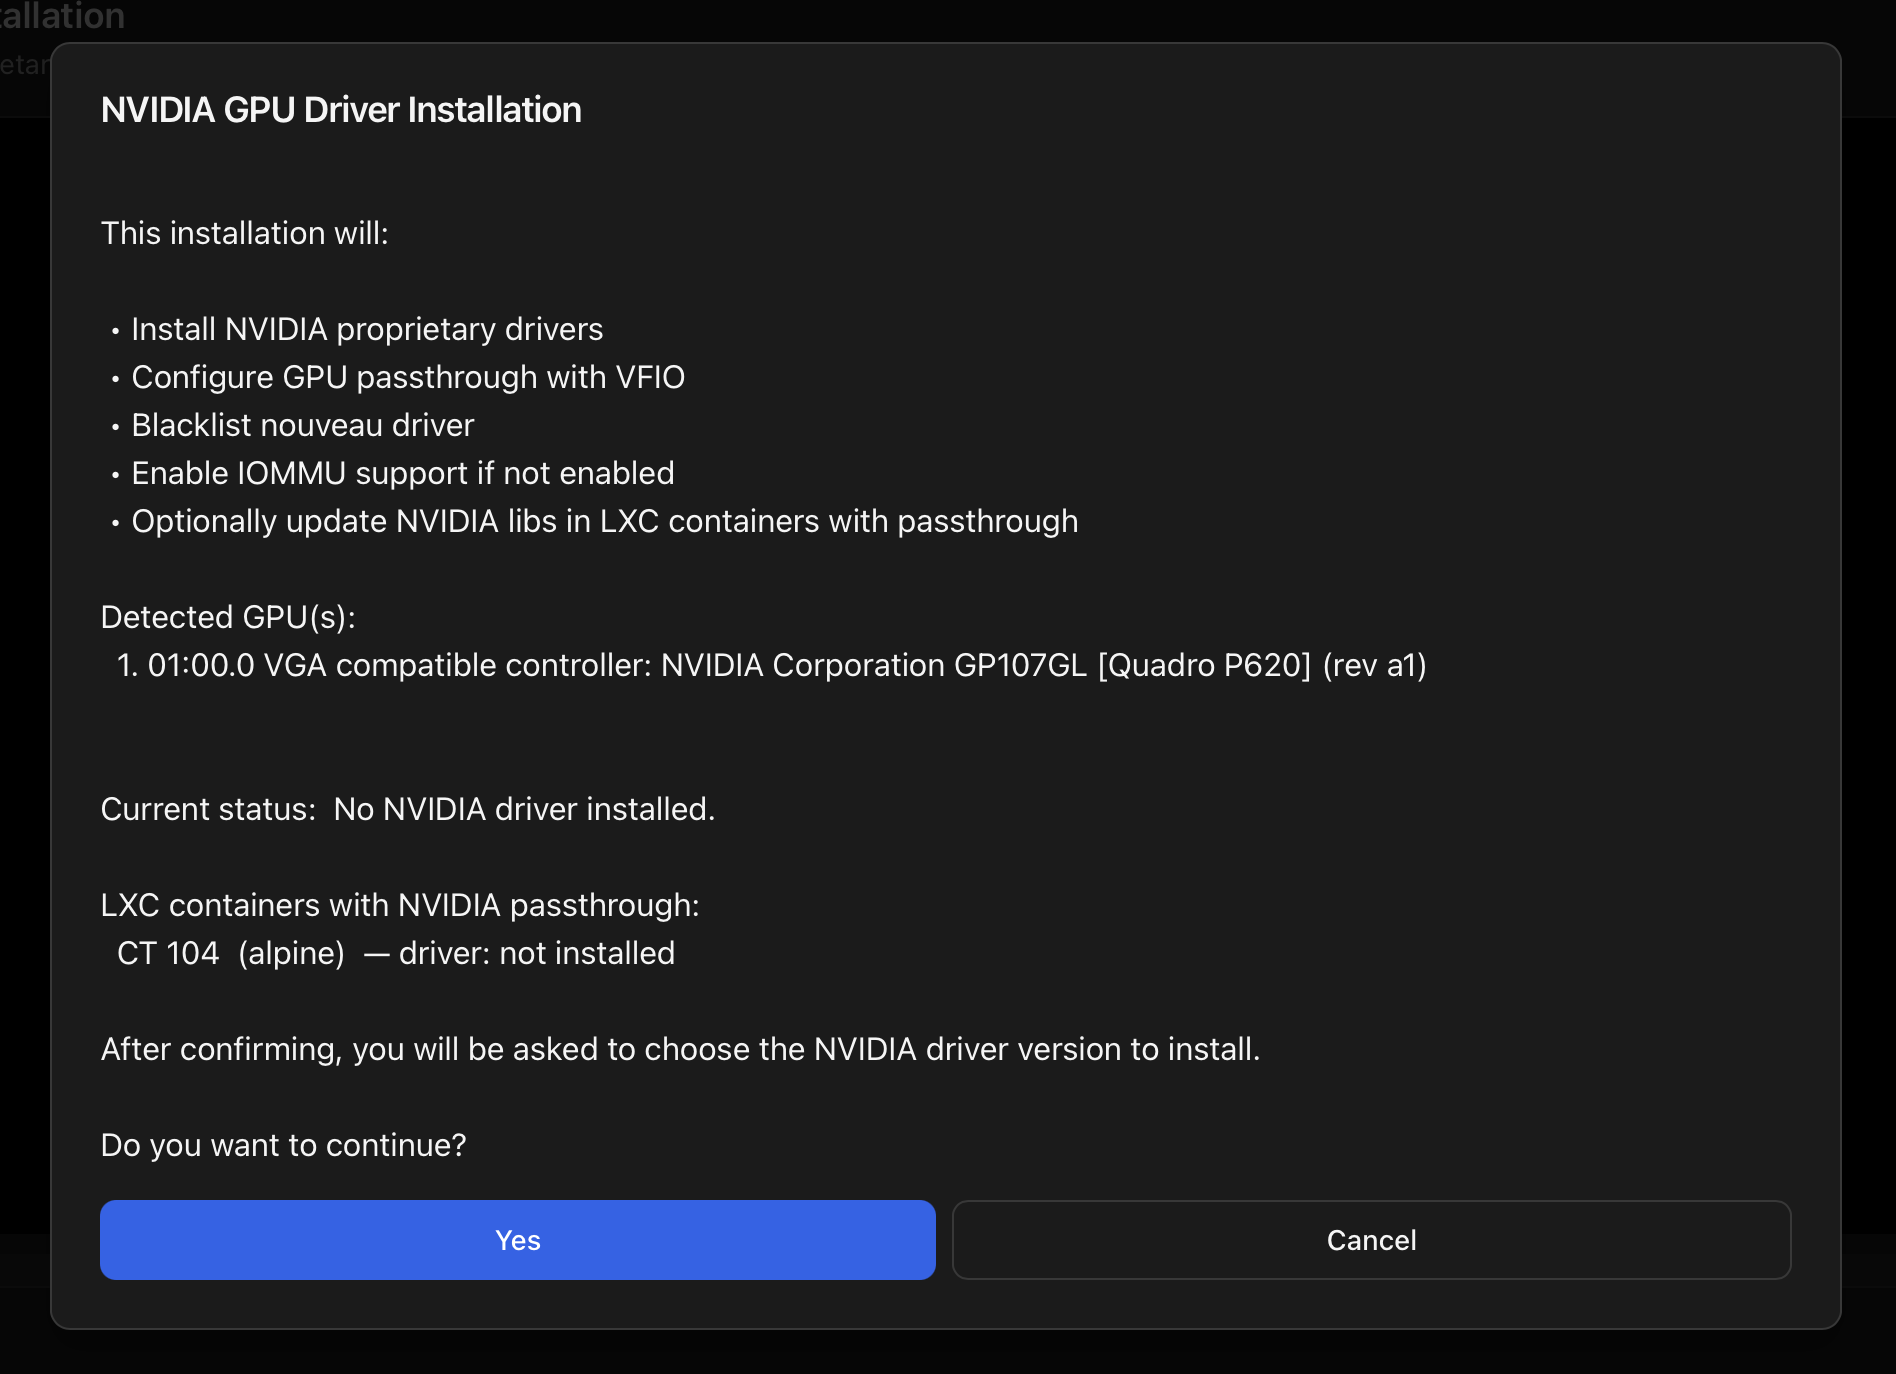
When an NVIDIA GPU is bound to nouveau/nvidiafb (no proprietary driver installed), the realtime block can't read clocks, power or per-process load. The modal then replaces the metrics with an Install NVIDIA Drivers button that wires straight into the same script documented at Install NVIDIA Drivers (Host).
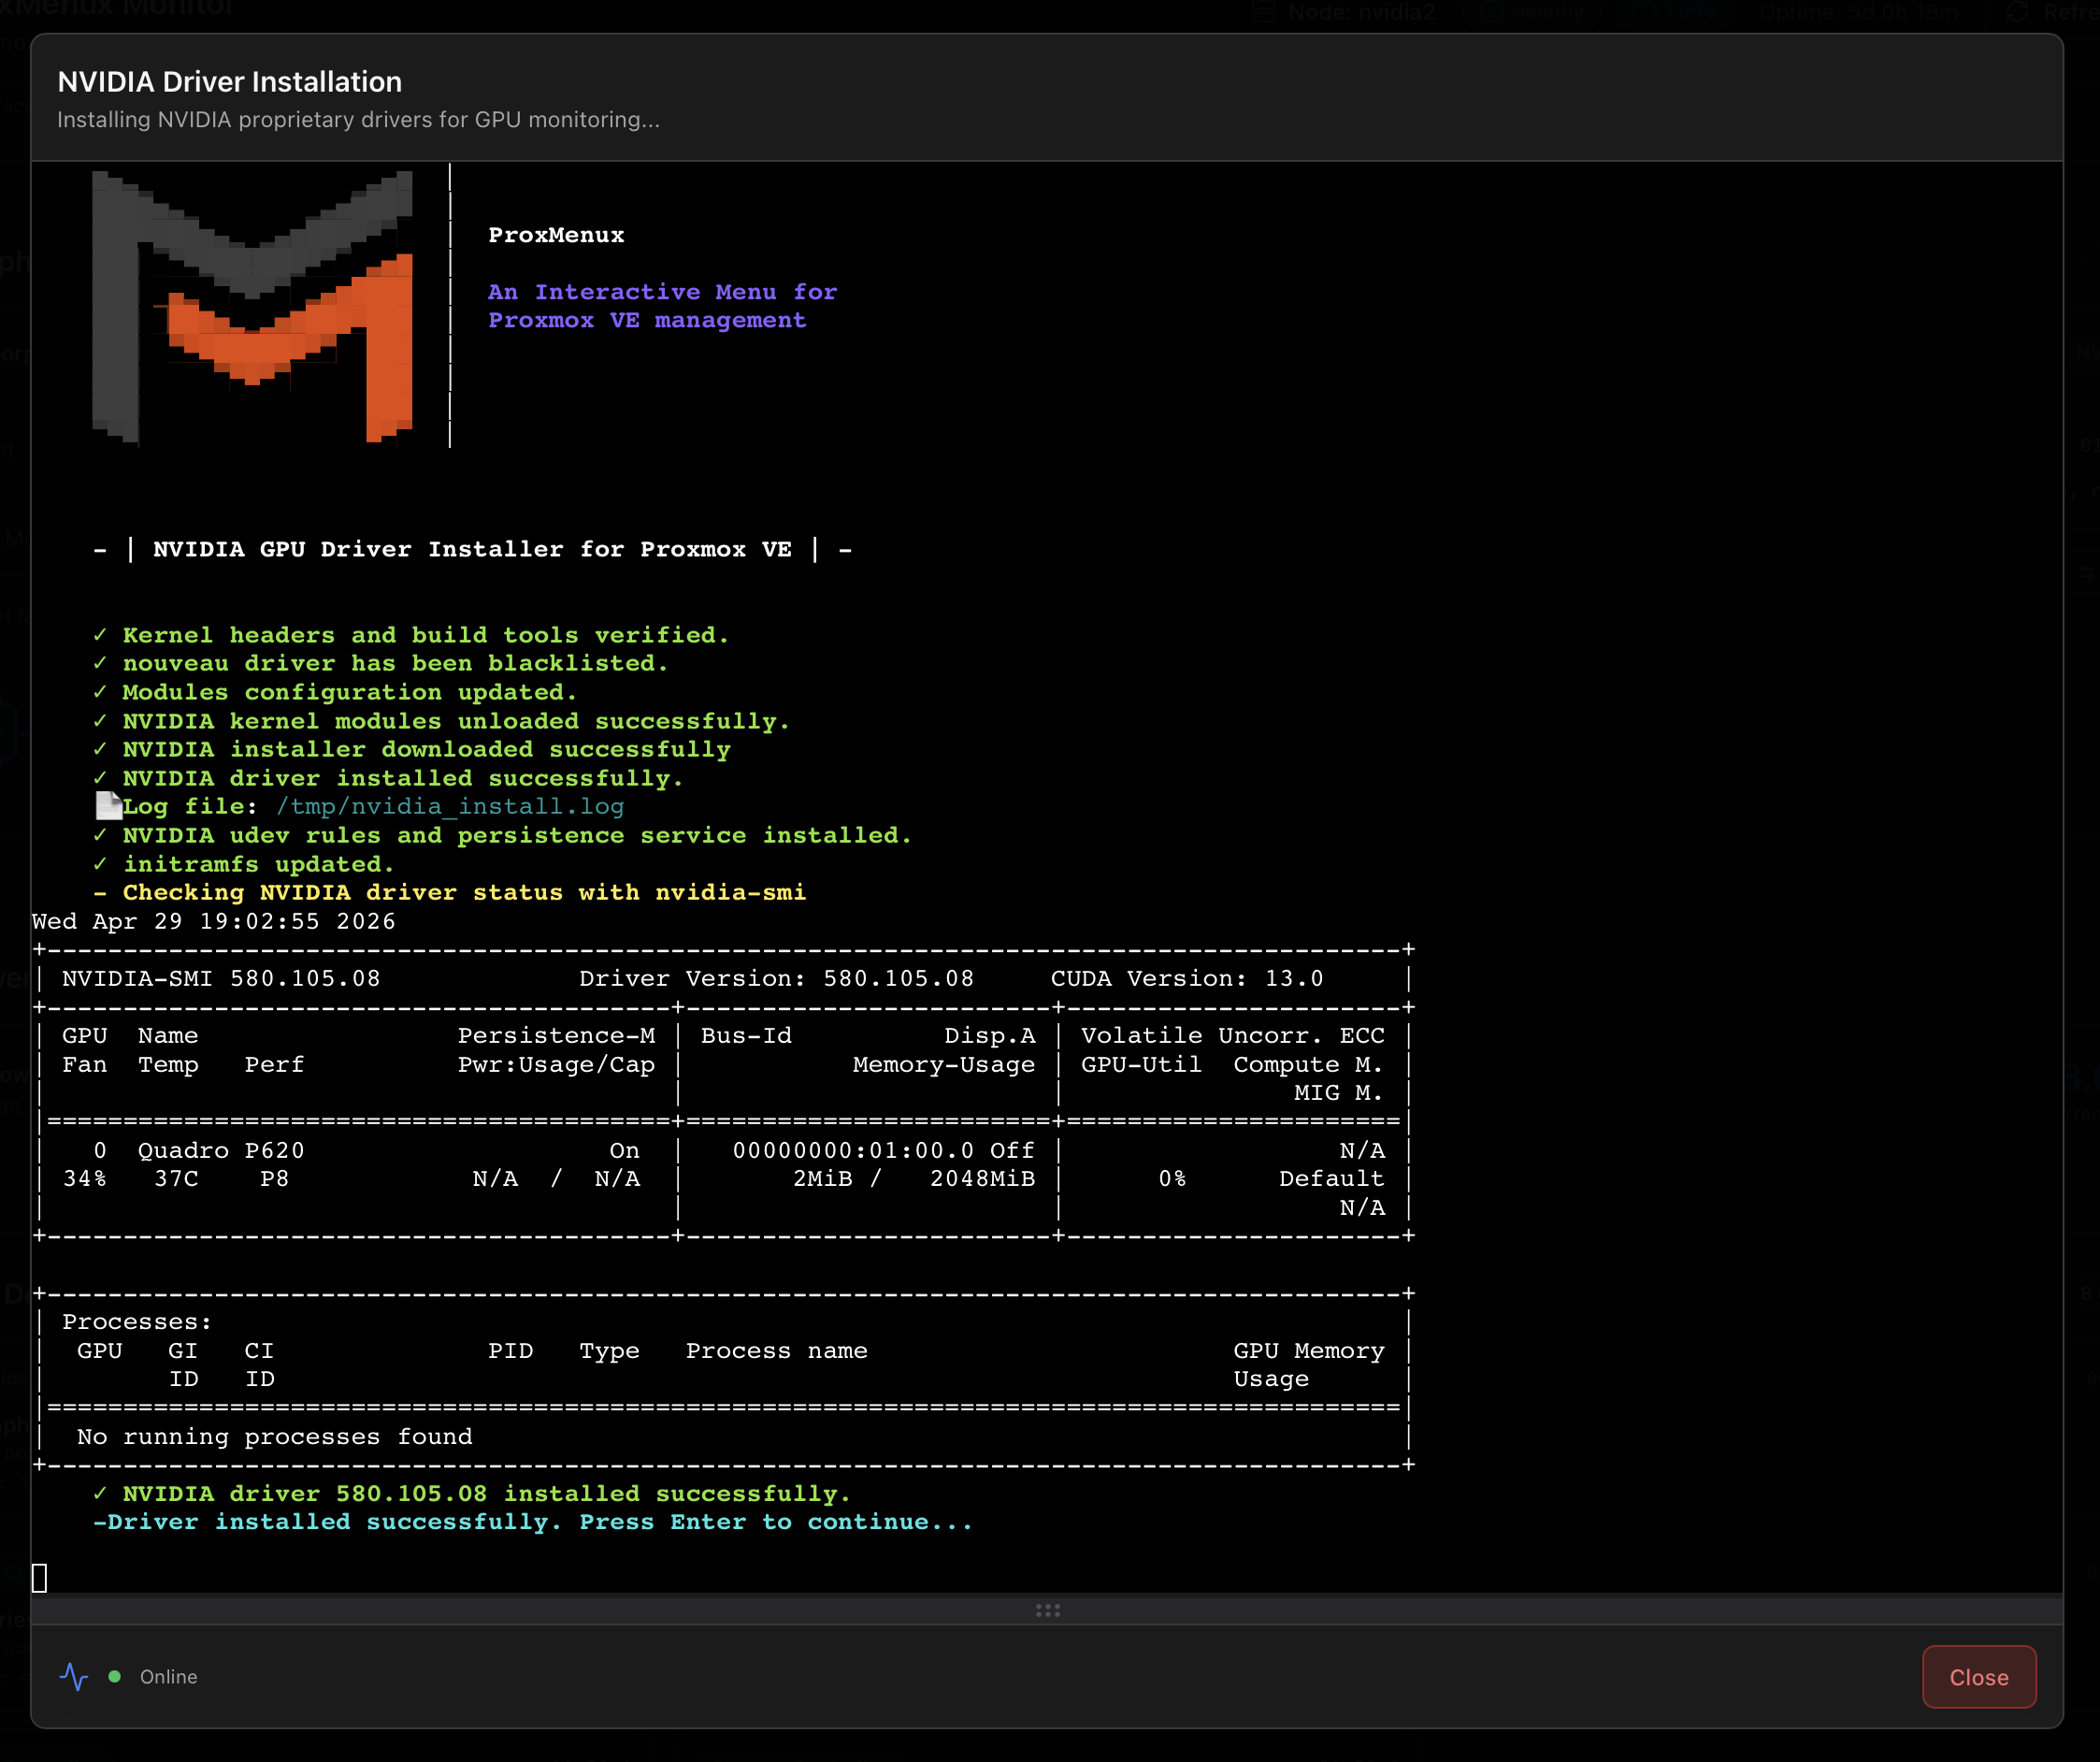
.run built via DKMS, the persistence service is in place, and nvidia-smi reports the GPU.Pick a driver version your GPU actually supports
nvidia-smi reports "No devices were found" or DKMS errors out, the chosen branch most likely doesn't cover your GPU — re-run the installer and pick an older branch (legacy 470.x for Kepler-era cards, etc.). NVIDIA publishes the per-GPU compatibility on the official driver lookup page.Where to go from here:
- Install NVIDIA Drivers (Host) — full walk-through of the installer, kernel-compatibility matrix, optional NVENC patch and LXC propagation.
- Switch GPU Mode (VM ↔ LXC) — what the inline Switch Mode control actually does.
- Add GPU to VM (Passthrough) and Add GPU to LXC — first-time assignment of an unbound GPU.
Coral TPU / AI Accelerators (conditional)
Renders when the host has Google Coral or other AI-accelerator devices wired up. Each device opens a modal with its connection type (M.2 / mini-PCIe / USB), PCIe link width, vendor / product ID, kernel driver (apex for PCIe, libedgetpu for USB), kernel modules (gasket + apex), device nodes (/dev/apex_*), Edge TPU runtime status, live temperature and the firmware hardware-warning thresholds.
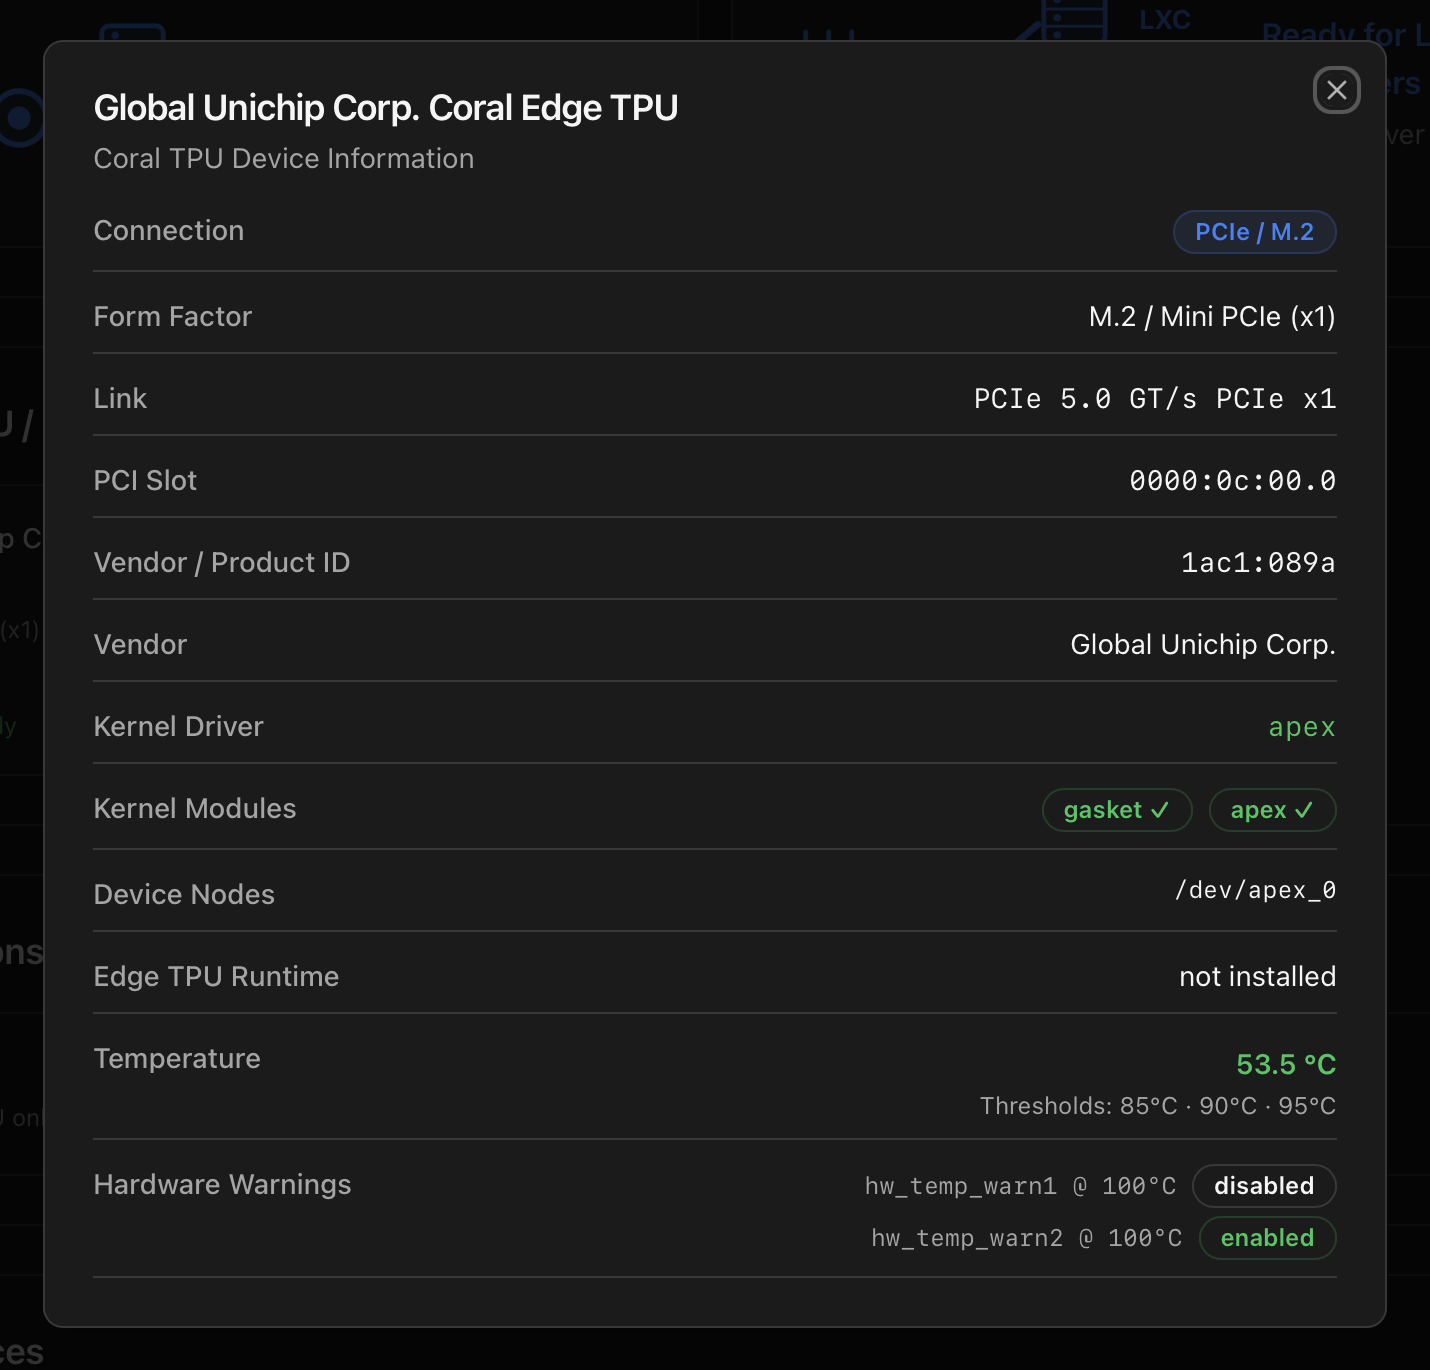
Two install paths exist depending on the form factor:
- M.2 / Mini-PCIe — the host needs the
gasket+apexkernel modules built via DKMS so the device node/dev/apex_0appears at boot. - USB Accelerator — the host only needs the Edge TPU user-space runtime (
libedgetpu1-std) from Google's APT repository.
Both are handled by a single ProxMenux entry — Install Coral TPU on the Host — which auto-detects what you have. Background and the official runtime live at coral.ai/docs. Once the host side is ready, hand the device to a container with Add Coral TPU to LXC.
Storage Summary
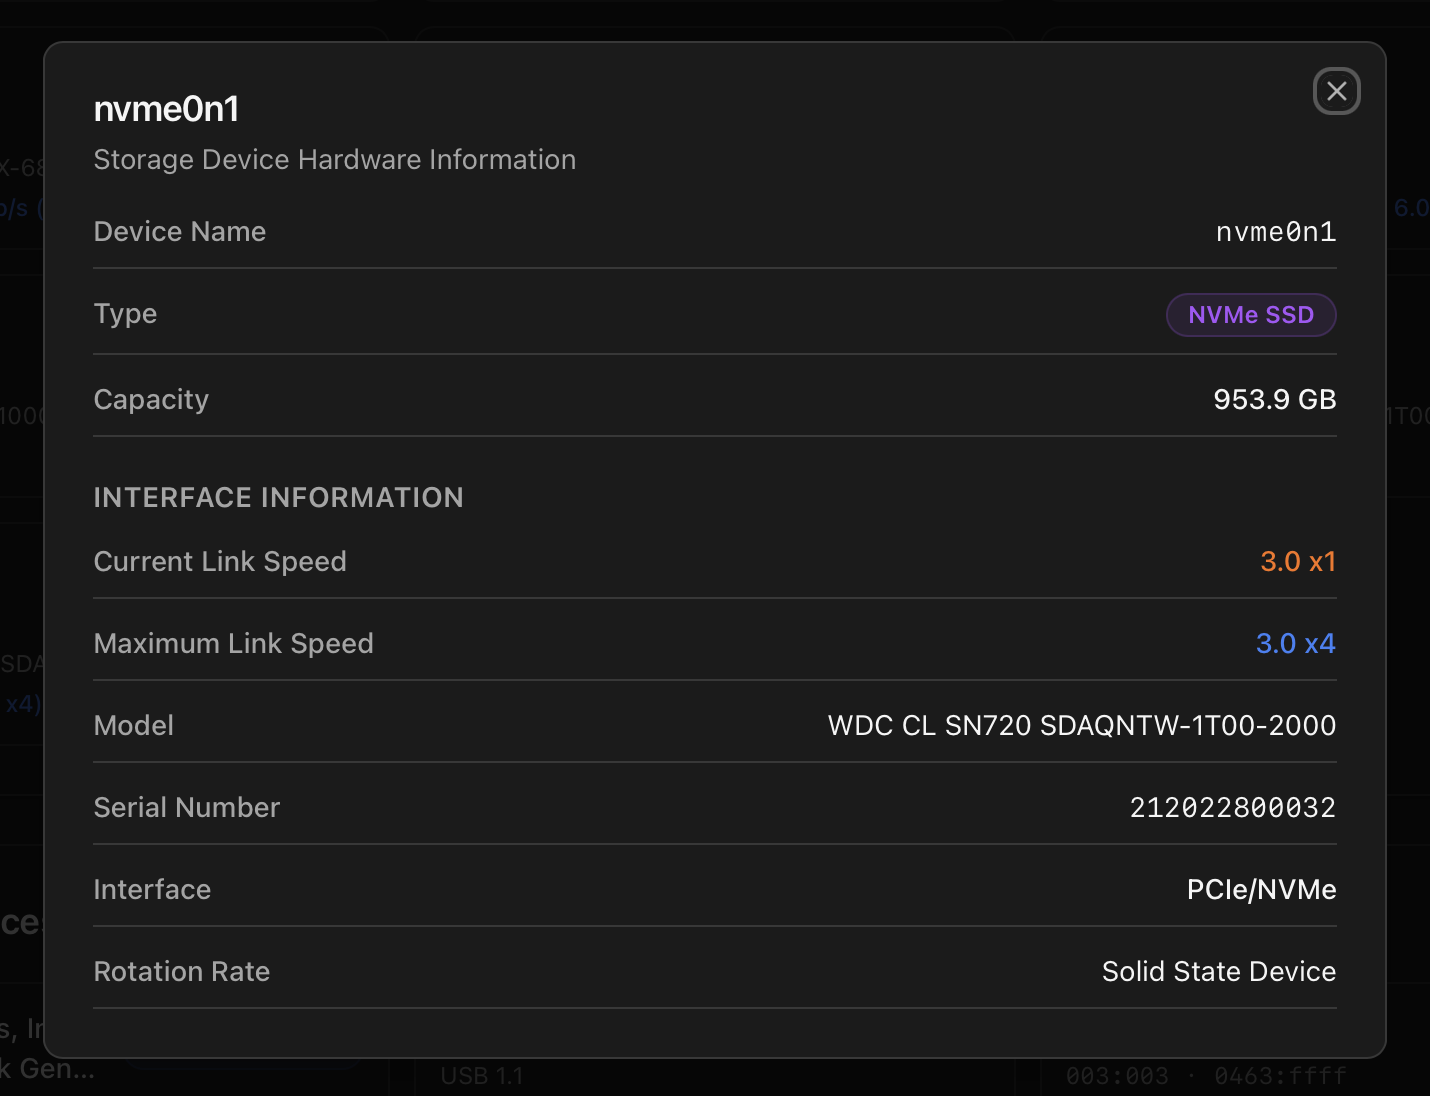
Every block device the kernel knows about, grouped by type. For each disk you get the kernel name (sda, nvme0n1, zram0 …), the type tag (SSD, HDD, NVMe SSD), the model string and the negotiated link information. Click any disk to open a hardware-info modal with model, serial, capacity, interface and current vs maximum link speed.
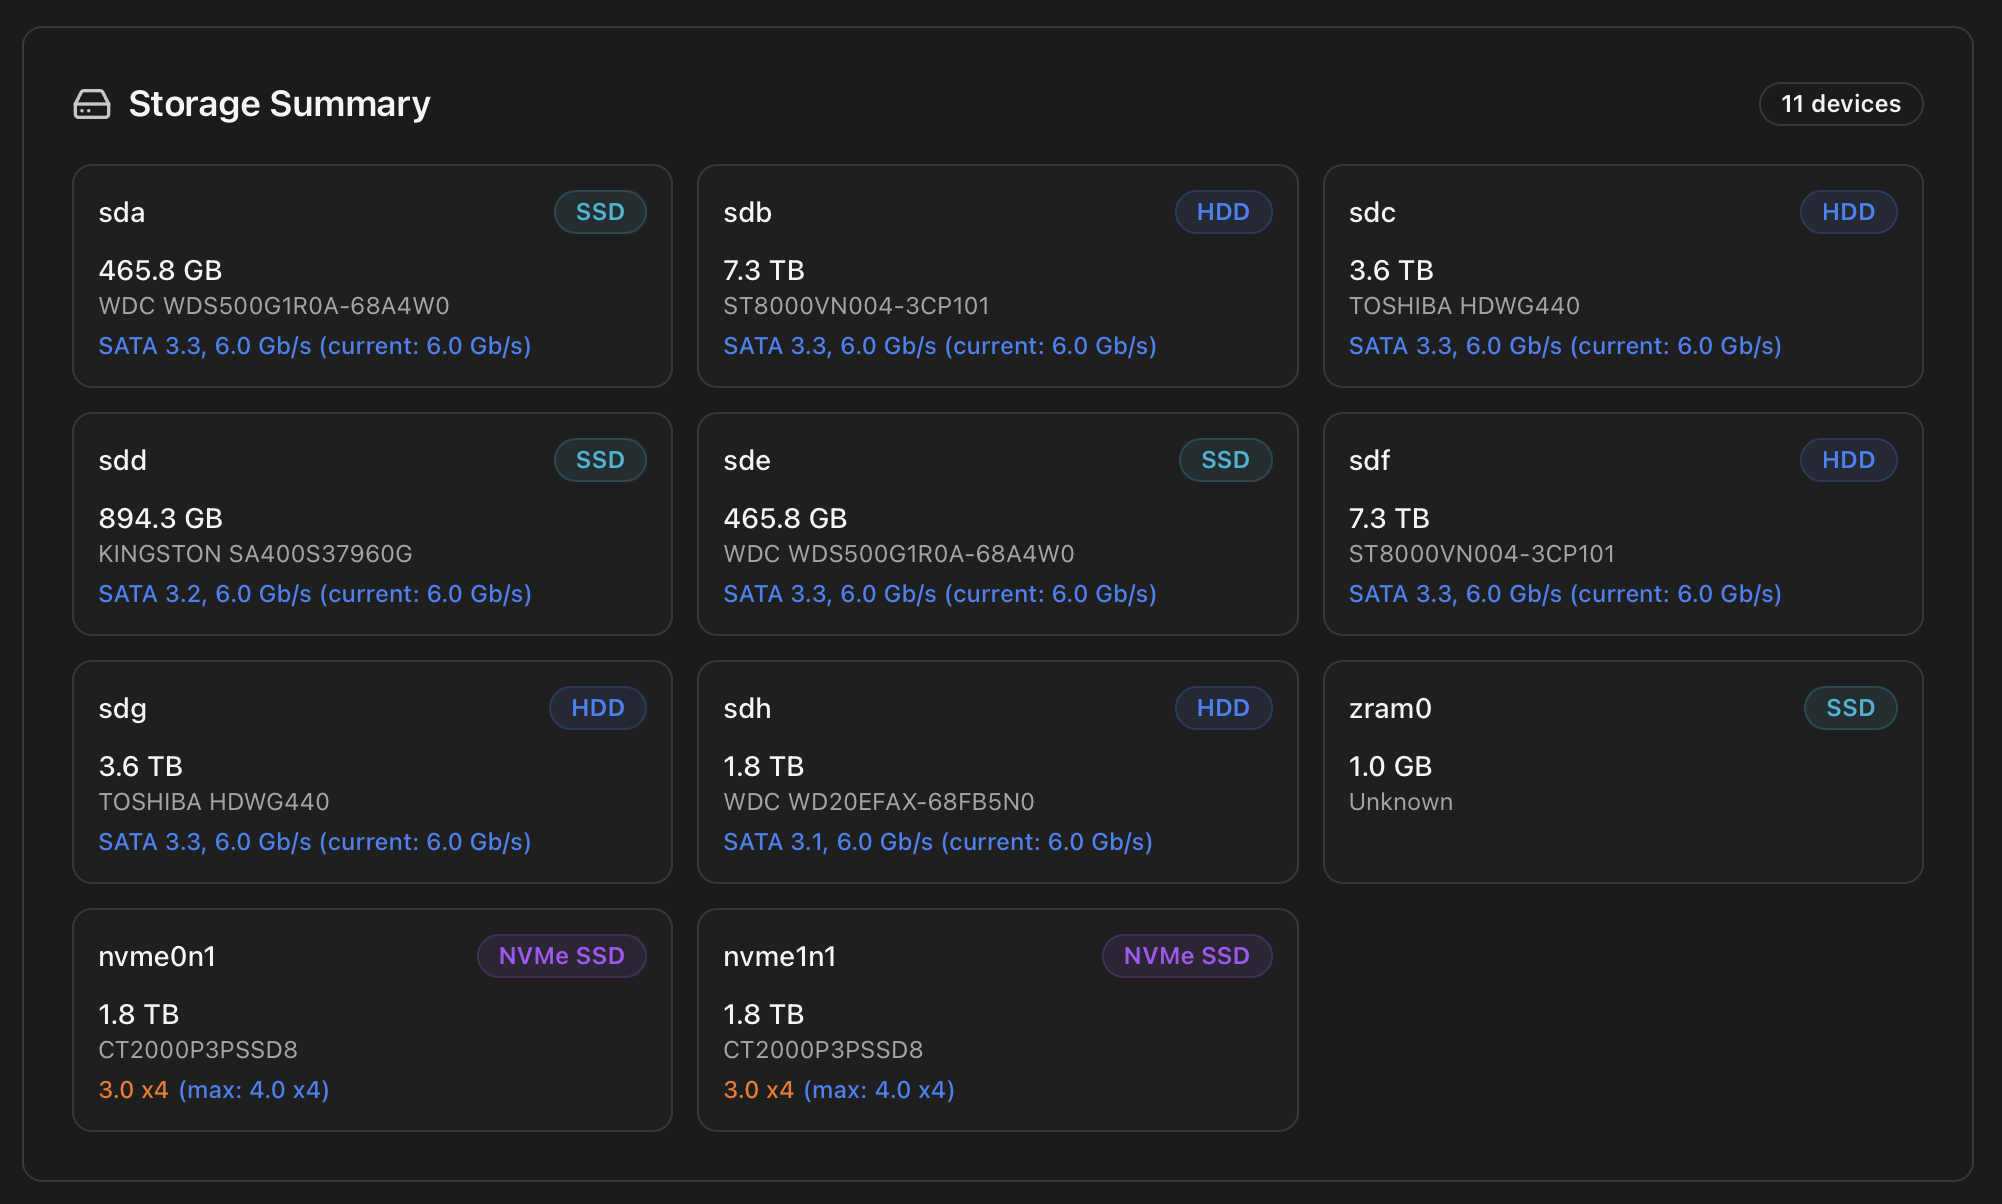
For NVMe drives the per-card line shows both the negotiated link and the maximum the device supports. When the two don't match (e.g. a Gen3 x4 SSD running at 3.0 x1 because it's sitting in a chipset slot wired to a single lane), the current speed is rendered in amber so the downgrade is visible at a glance — useful when troubleshooting unexpectedly slow disks or after a BIOS update remaps the lanes.
SMART data, self-tests, history and the PDF disk report all live one tab over, in Dashboard: Storage tab. The same data feeds the script at SMART Disk Health & Test — running a long test from the script writes the JSON the Monitor displays in Storage → History.
PCI Devices
Every PCI-addressable device, identified by its PCI BDF (Bus:Device.Function — e.g. 03:00.0) and its device class (Storage Controller, USB Controller, Graphics Card, Network Controller, Audio Controller …). Each card shows the manufacturer, the device name and the kernel driver currently bound — which is the field you actually want when troubleshooting passthrough, IOMMU groups or a card the host isn't driving correctly.
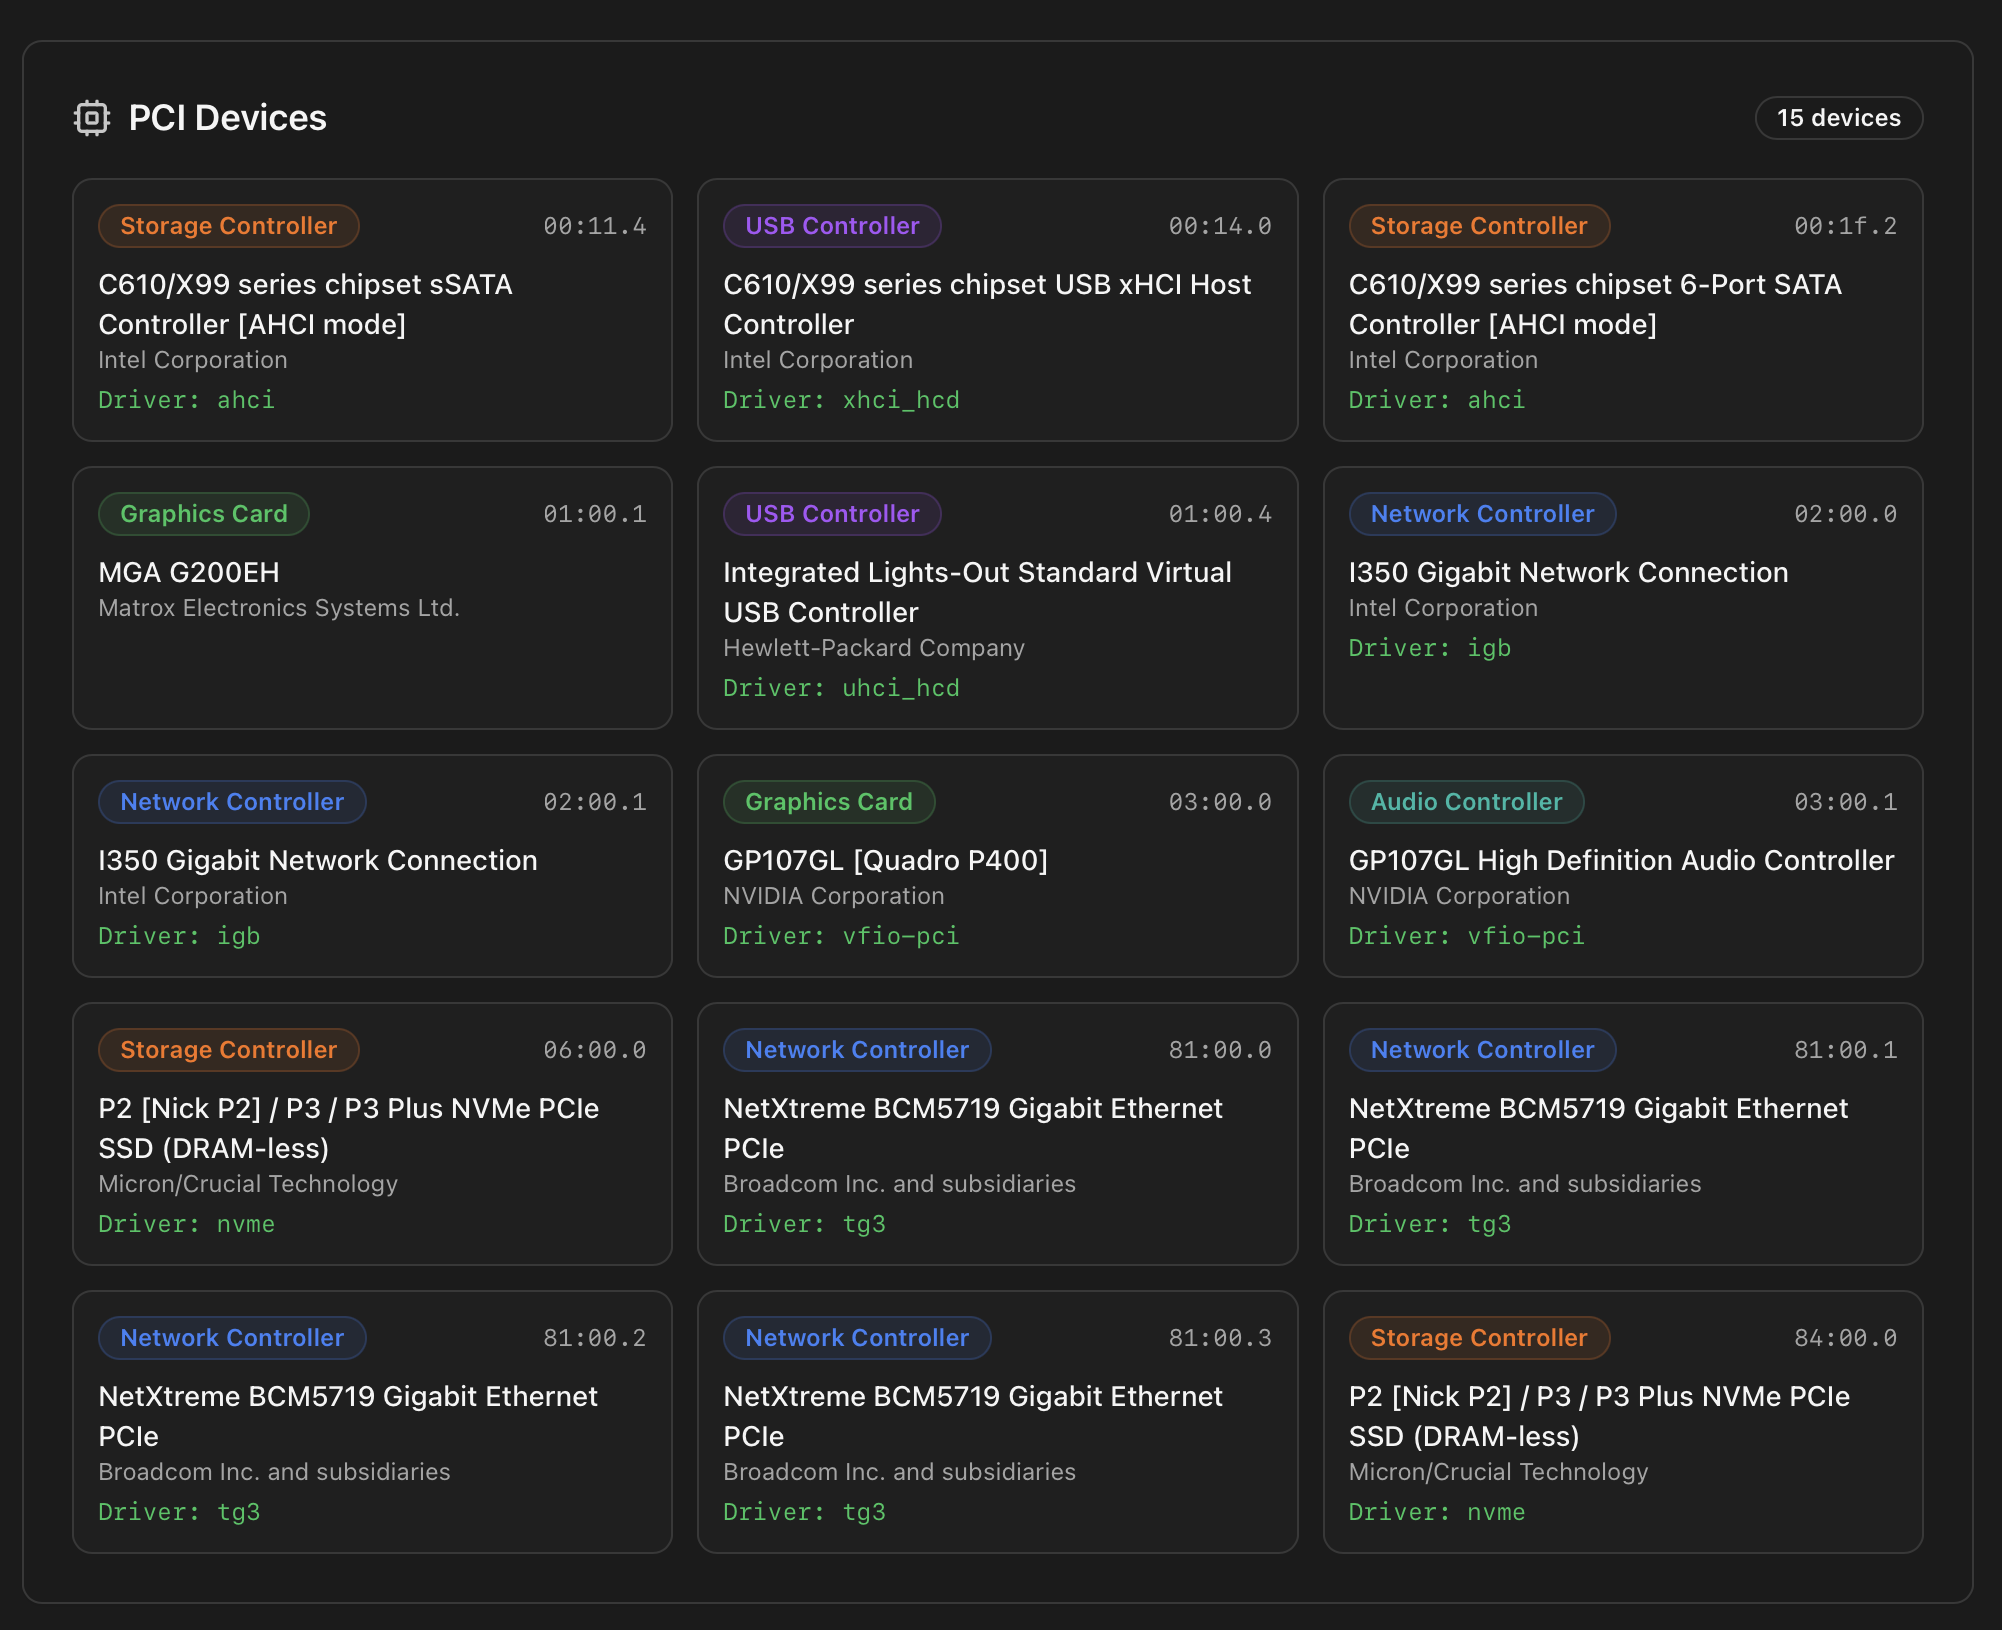
vfio-pci — that's a card prepared for VM passthrough.Reading the BDF
03:00.0 means PCI bus 03, device 00, function 0. Multifunction devices like discrete GPUs typically claim .0 for the GPU and .1 for the HDMI audio function — both have to be passed through together, which is why Switch GPU Mode also handles the orphan-audio cleanup when leaving VM mode.USB Devices
Every USB device the host enumerates, with manufacturer / product strings, USB version, the bus:device address, the vendor:product ID pair and the kernel driver. The renderer also classifies common roles — Communications (Z-Wave / Zigbee sticks), UPS, storage, HID — so you can spot at a glance which of your sticks is which without cross-referencing IDs.
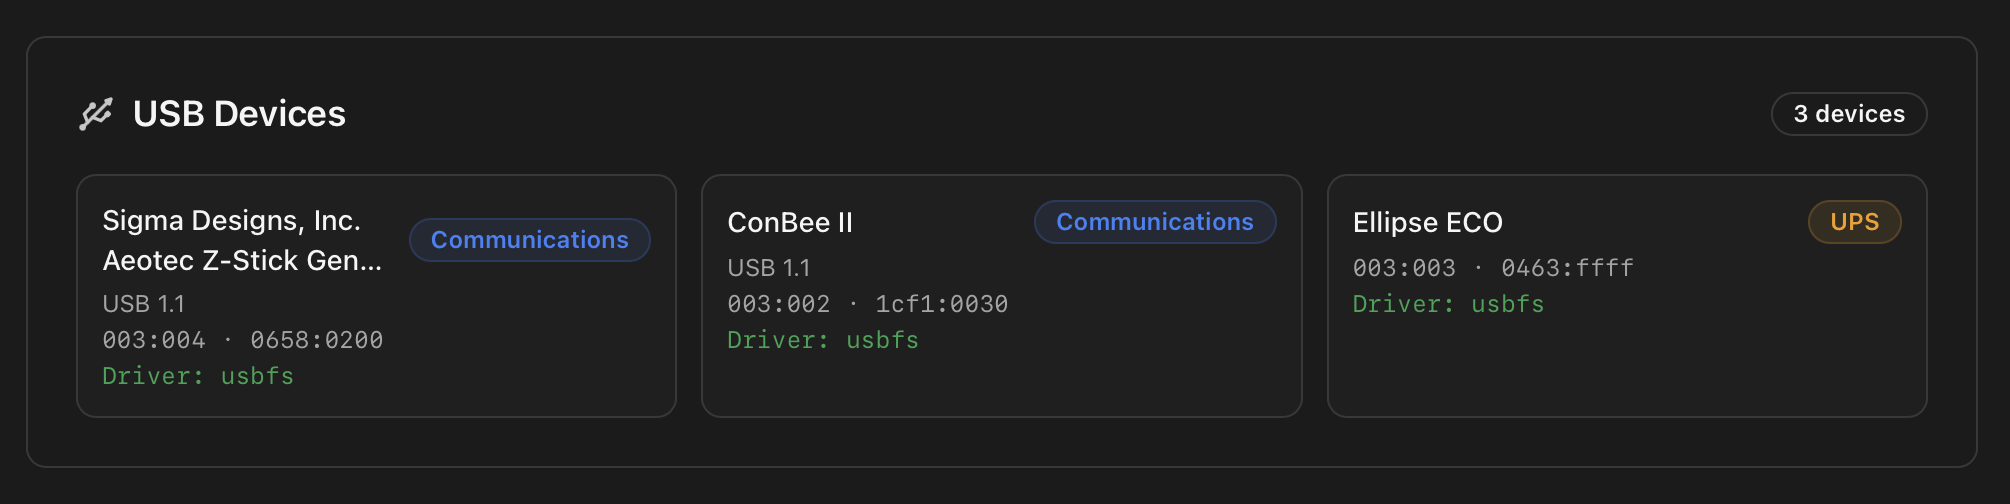
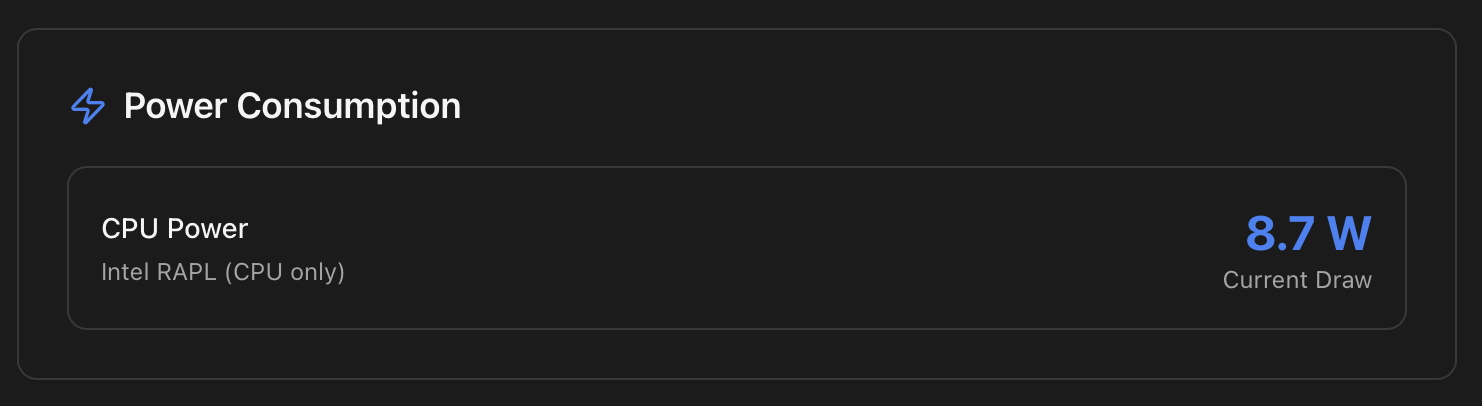
usbfs and a UPS on usbfs (NUT talks to it through libusb).Power Consumption (conditional)
Renders only when the host exposes power telemetry. Two independent sources are surfaced when available:
- ACPI / IPMI total draw — whole-system wattage from a board-level sensor or the BMC. Typical on server boards.
- CPU package power — read from the Intel RAPL counters (or AMD equivalent). Useful to separate CPU draw from the rest of the system on consumer boards that don't expose a total figure.
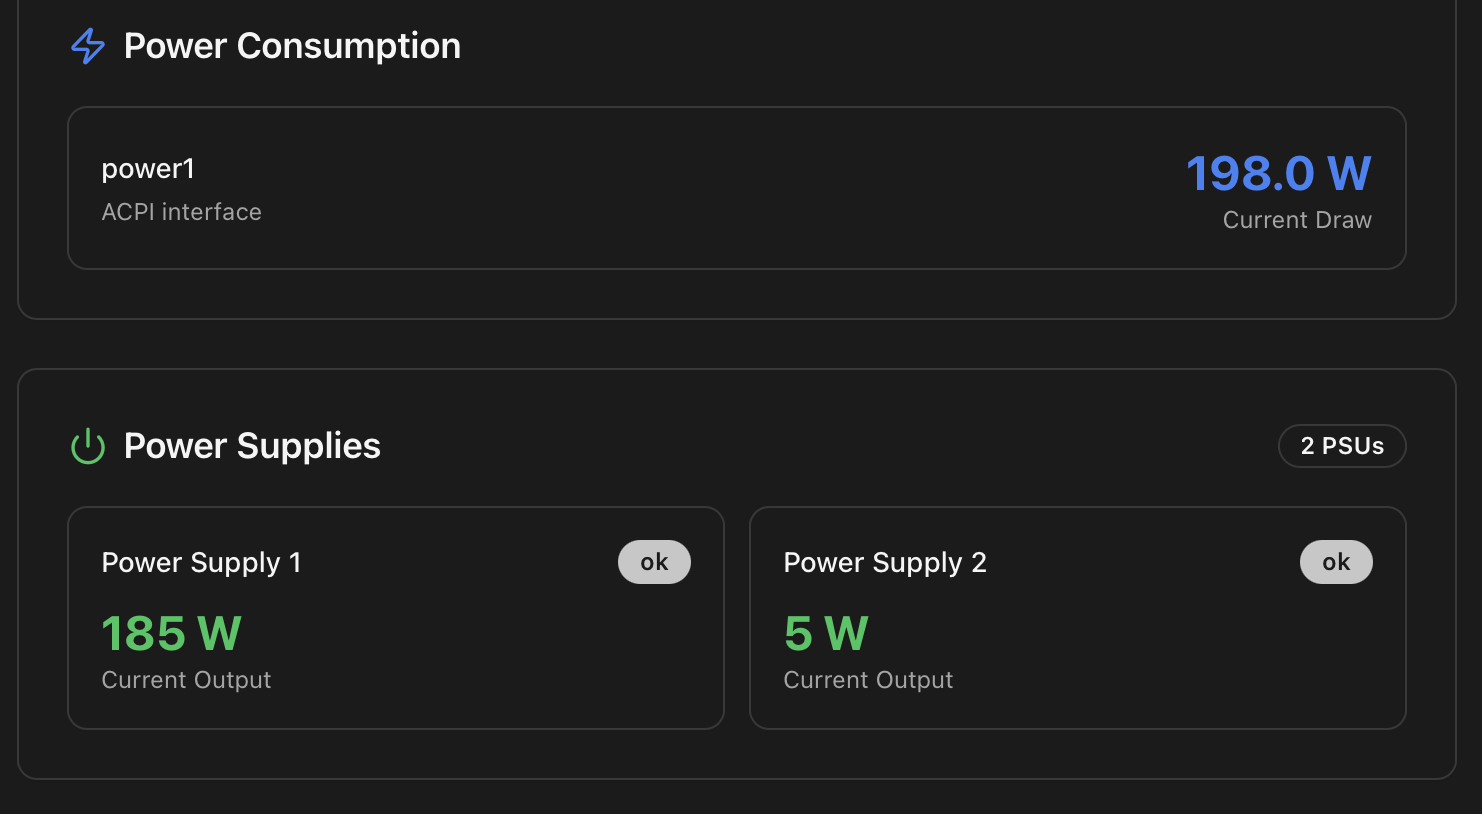
Power Supplies (conditional)
Server-board / dual-PSU machines via IPMI: presence (PSU 1 / PSU 2 / …), input voltage, output wattage, OK / failed flag. The first thing you check after a power blip on a node with redundant PSUs.
System Fans (conditional)
Per-fan RPM with a small sparkline (when supported). On boards without per-fan reporting the section falls back to a single chassis-fan reading.
UPS Status (conditional)
Renders when a NUT (Network UPS Tools) server is configured and reachable. Shows: state (online / on battery / charging / low battery), battery charge percentage, runtime estimate, load percentage, input voltage, model and firmware. The same data feeds the Security & Certificates category of the Health Monitor — a UPS that goes on-battery surfaces immediately.
How the data is collected
| Section of the tab | Endpoint | Source |
|---|---|---|
| Static inventory (PCI, CPU, BIOS) | /api/hardware | lspci -vmm, /proc/cpuinfo, dmidecode; cached for the lifetime of the process. |
| Live sensor values | /api/hardware/live | sensors (lm-sensors), package temperatures, fan RPM. Refreshed each request. |
| CPU temperature history | /api/temperature/history | Time series sampled by the Health Monitor every 5 min and persisted to SQLite. |
| GPU live metrics | /api/gpu/<slot>/realtime | NVIDIA: nvidia-smi --query-gpu=.... Intel: intel_gpu_top. AMD: sysfs /sys/class/drm/cardN. |
# Cross-check inventory against the OS view
lspci -nnk | grep -A2 -E 'VGA|Audio|Network|3D'
sensors

# Confirm the GPU card the dashboard sees
curl -H "Authorization: Bearer <token>" \
  http://<host>:8008/api/hardware | jq '.gpus'
Where to next
- Install NVIDIA Drivers (Host) — what the GPU modal's install button runs.
- Switch GPU Mode (VM ↔ LXC) — what the inline mode switch on each GPU card does to the host.
- Install Coral TPU on the Host — the Coral kernel module / runtime install.
- SMART Disk Health & Test — the script behind the SMART data shown in the Storage tab's disk drill-in.
- Dashboard: Storage tab — full SMART attribute table, self-test history and PDF report.
- Health Monitor — the CPU & Temperature category that consumes the same sensors.
- API Reference — the hardware and GPU endpoints.
- Dashboard index — the other tabs.