Dashboard: Security tab
Every security control in the dashboard, grouped into two clearly-labelled blocks: configuration of the Monitor itself (auth, SSL, tokens, Secure Gateway) and configuration of the Proxmox host it watches (firewall, Fail2Ban, Lynis).
Two scopes, one tab
ProxMenux Monitor
Four cards control how the dashboard itself is reached and authenticated.
Authentication
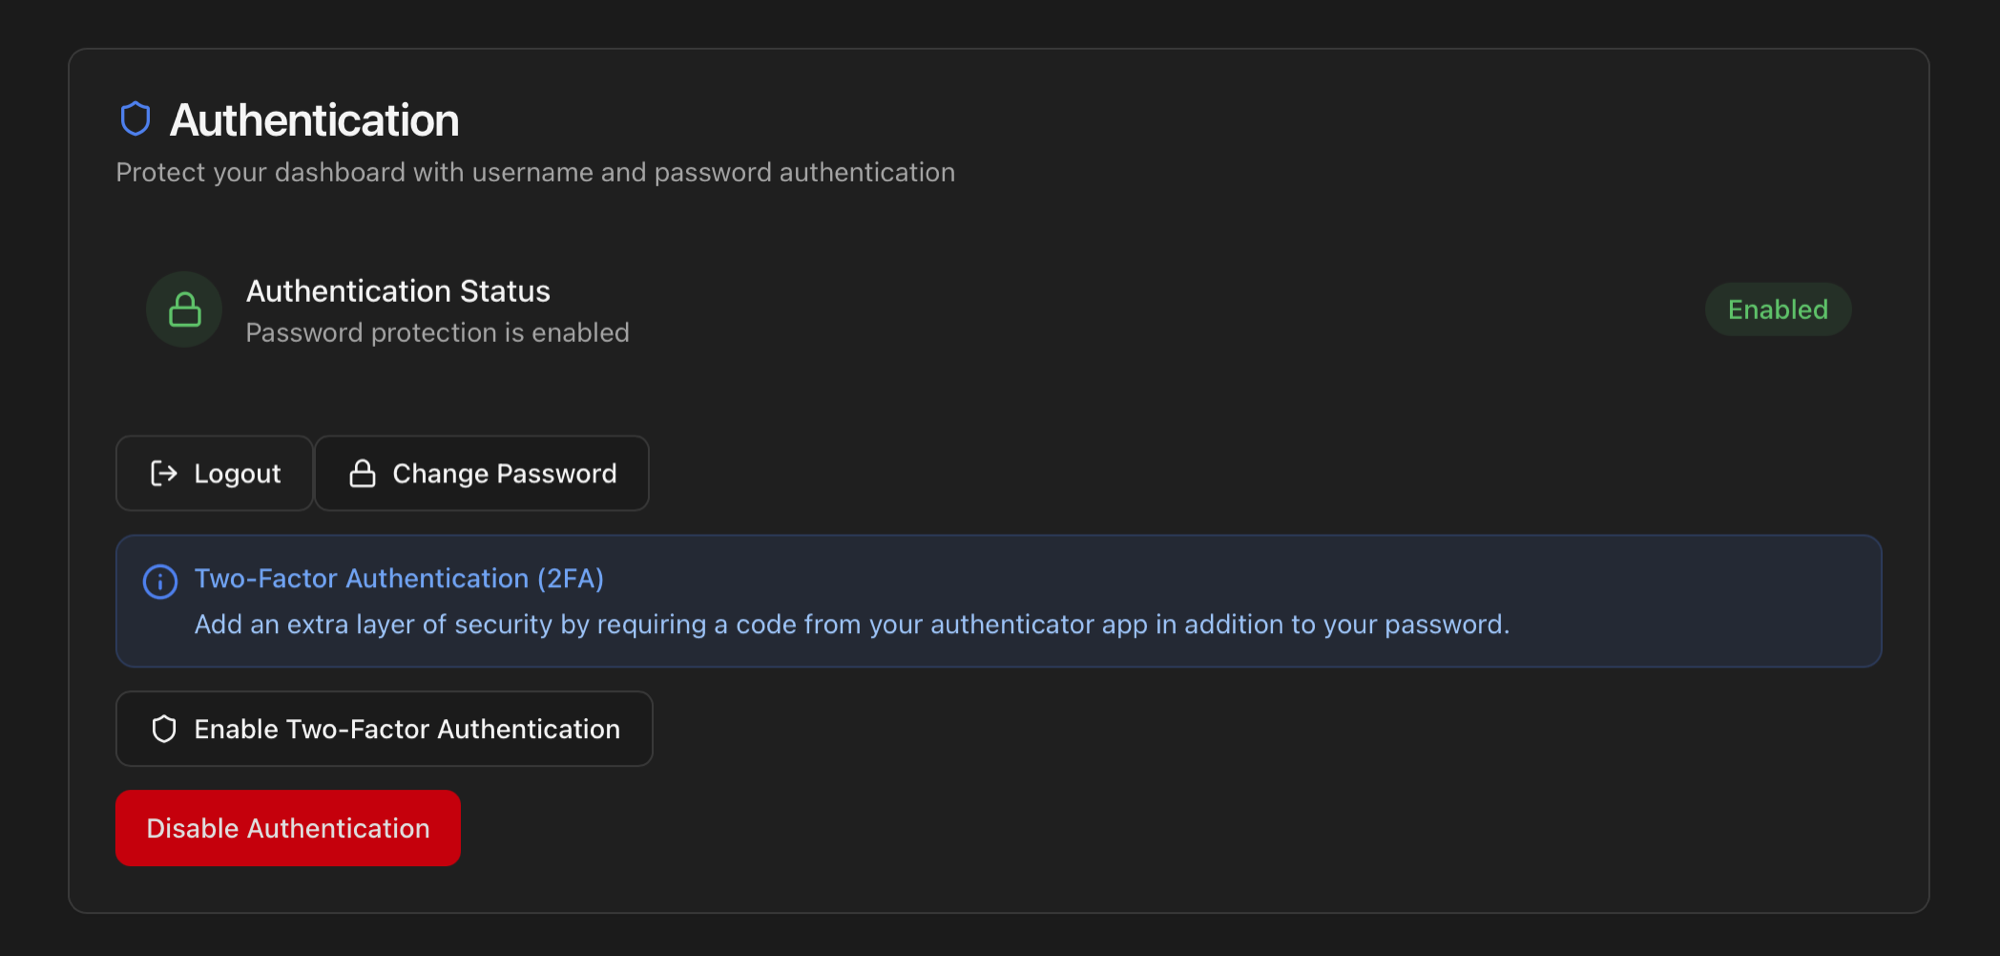
The card lets you manage the dashboard's own login. The full first-launch flow, password policy, TOTP enrolment screens and lost-authenticator recovery are documented in Access & Authentication — this card is the day-to-day surface for those settings:
- Authentication Status — badge showing Enabled / Disabled / Declined.
- Change Password — current password + new password + confirmation.
- Enable / Disable Two-Factor Authentication — opens the QR enrolment dialog when enabling, asks for the current password when disabling.
- Disable Authentication — destructive action that re-shows the first-launch Protect your dashboard? dialog on next visit.
SSL / HTTPS
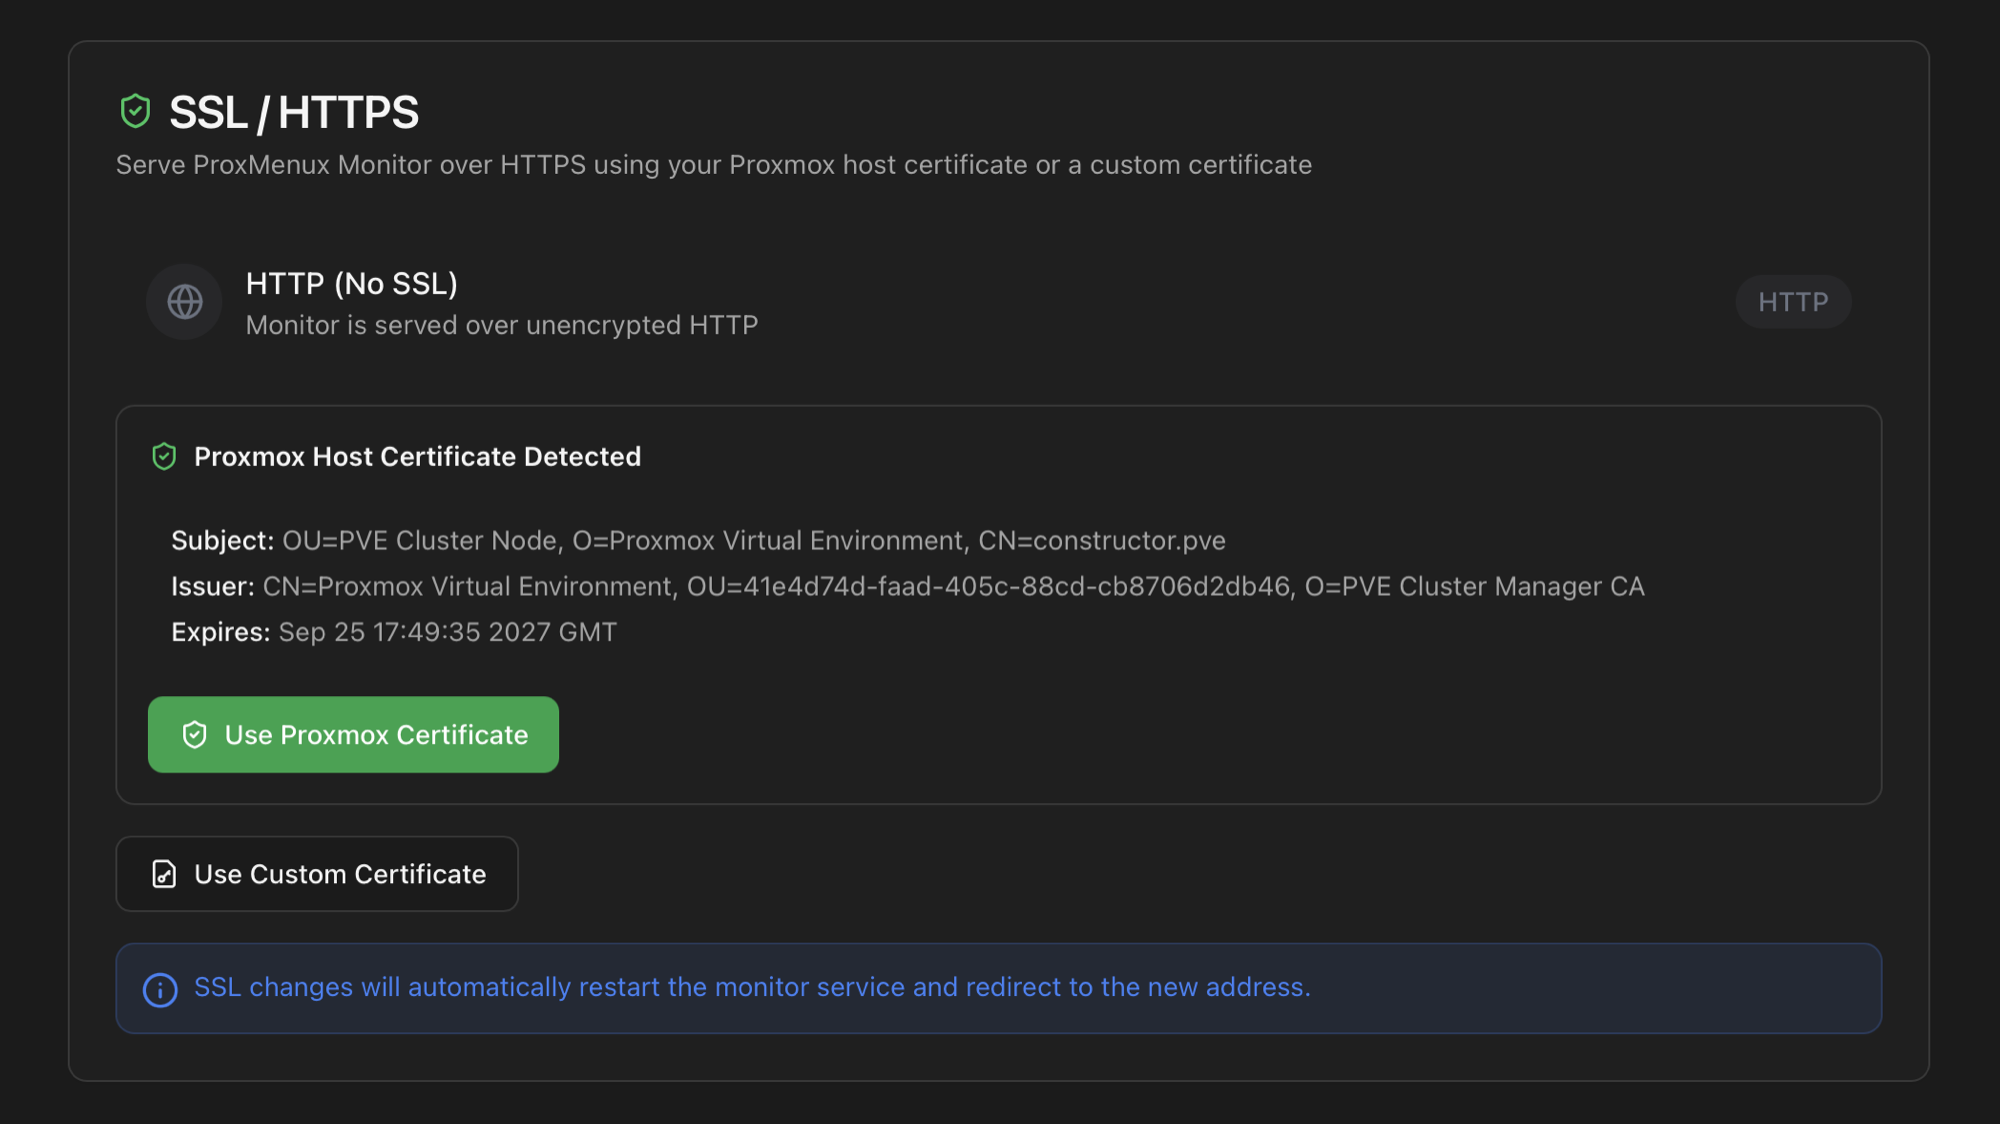
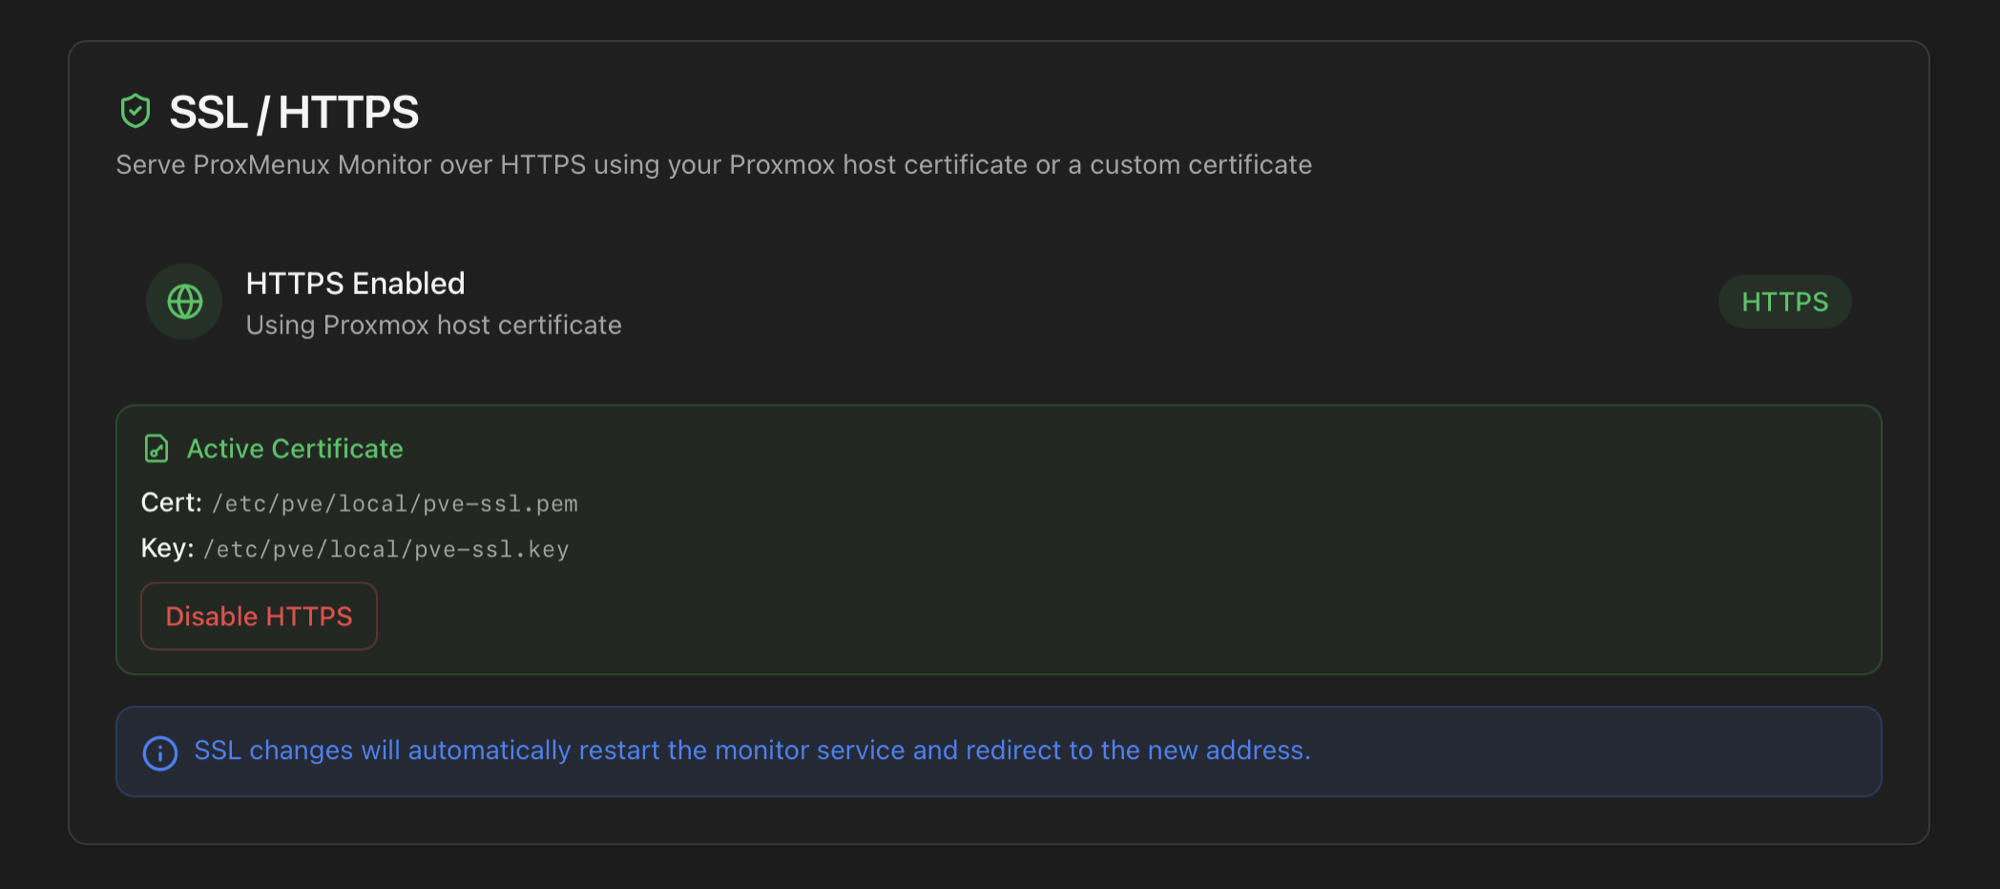
Serves the dashboard over HTTPS without any reverse proxy in front. The card auto-detects the certificate that Proxmox itself uses (under /etc/pve/local/) and shows the subject, issuer and expiry so you can verify it before activating. Two paths to enable HTTPS:
- Use Proxmox Certificate — one click. The Monitor reuses the certificate installed on the host. Good fit for users who already have their PVE running on the same DNS name as the dashboard.
- Use Custom Certificate — paste absolute paths to your own
.pemcertificate and.keyprivate key. The paths are validated before the service restarts; if loading fails, the dashboard falls back to HTTP automatically (no broken state).
ACME / Let's Encrypt via Proxmox
For a step-by-step walkthrough — including how the Monitor auto-detects the ACME-uploaded certificate, what gets written to disk, and how to fall back to a custom .pem / .key pair — see HTTPS for ProxMenux Monitor.
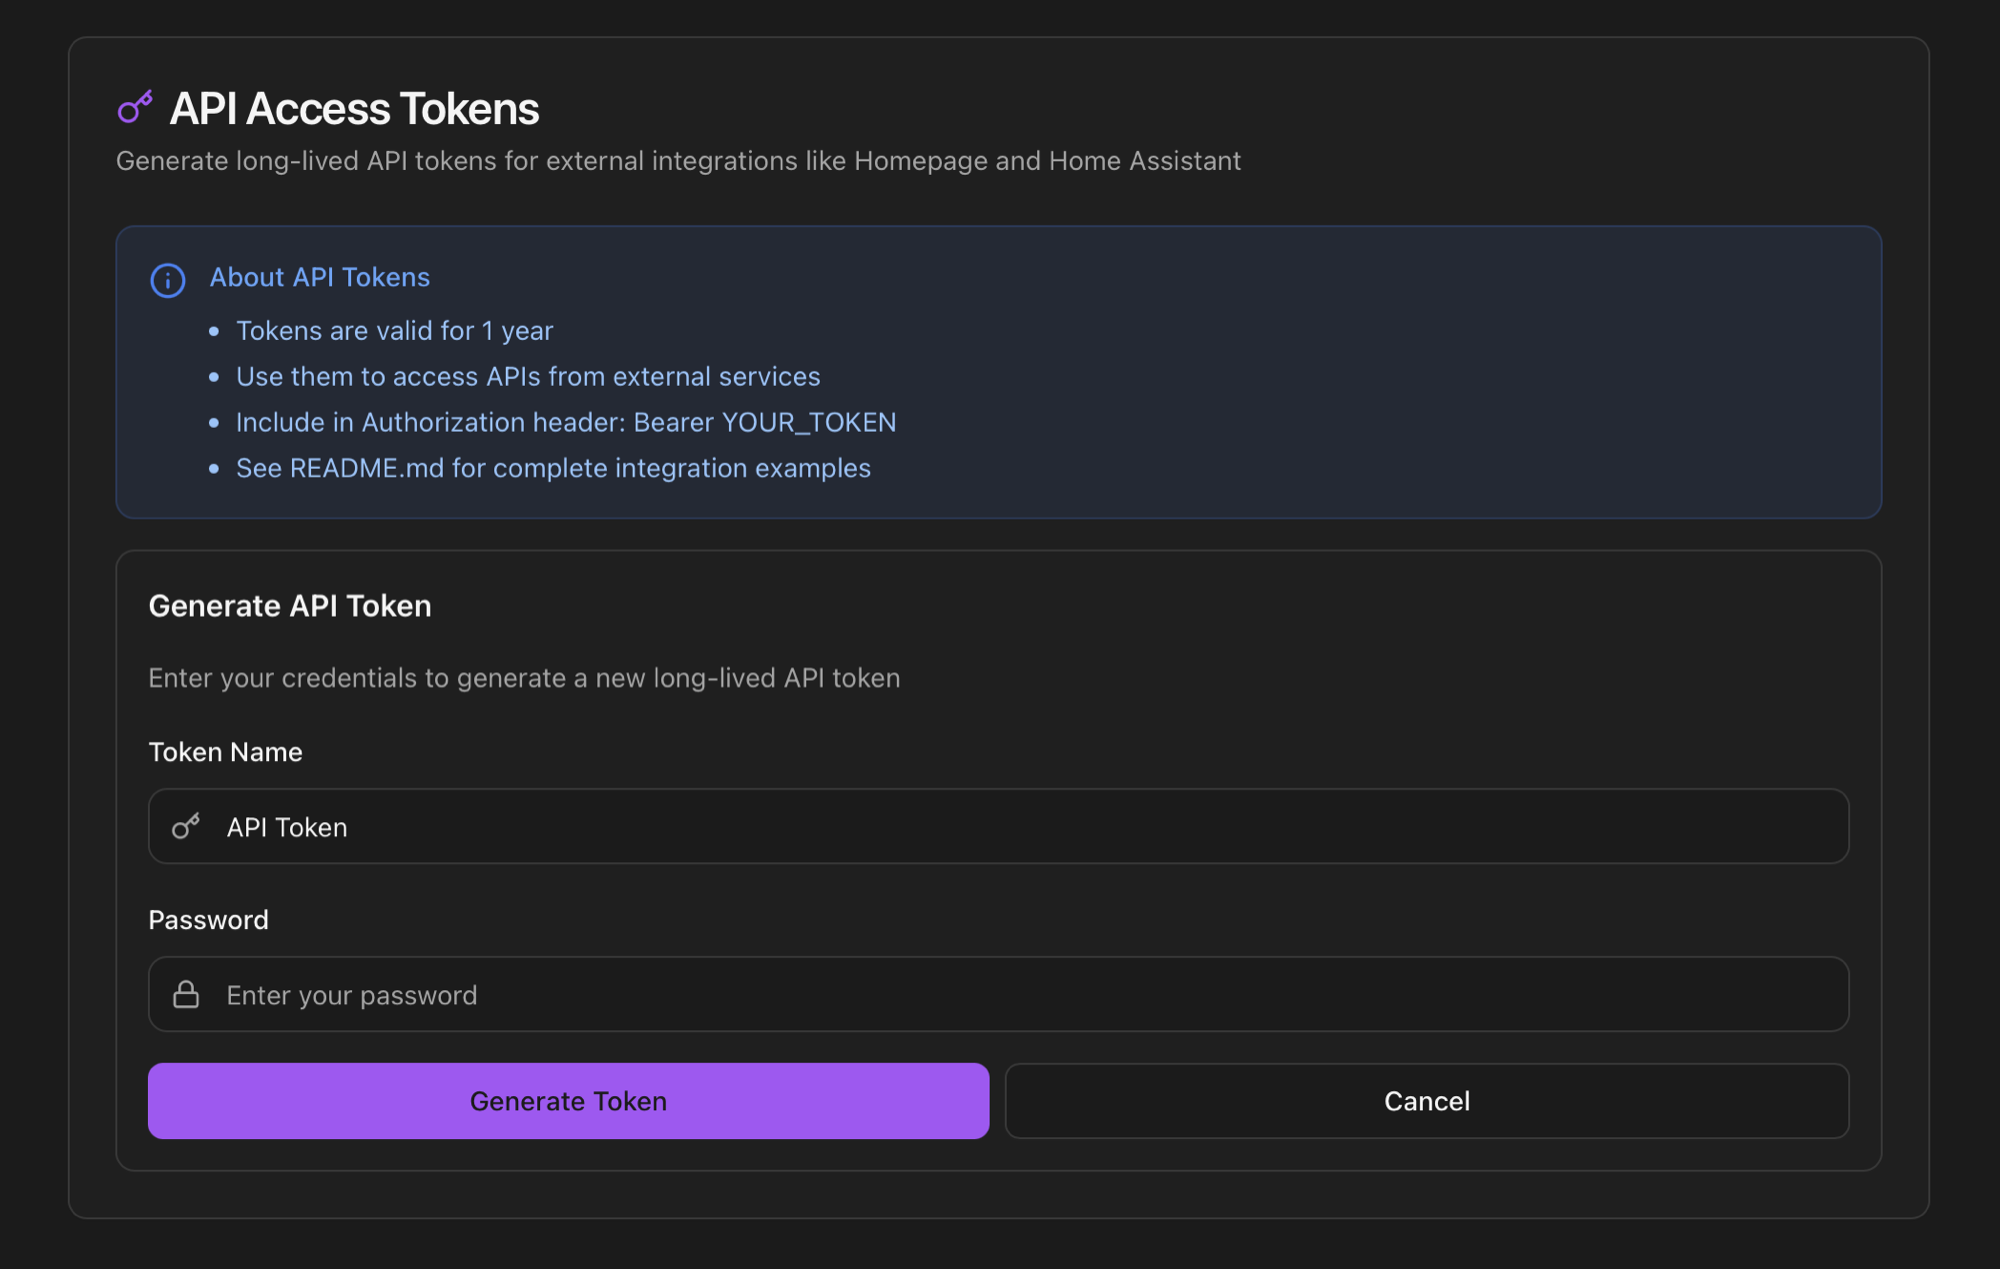
API Access Tokens
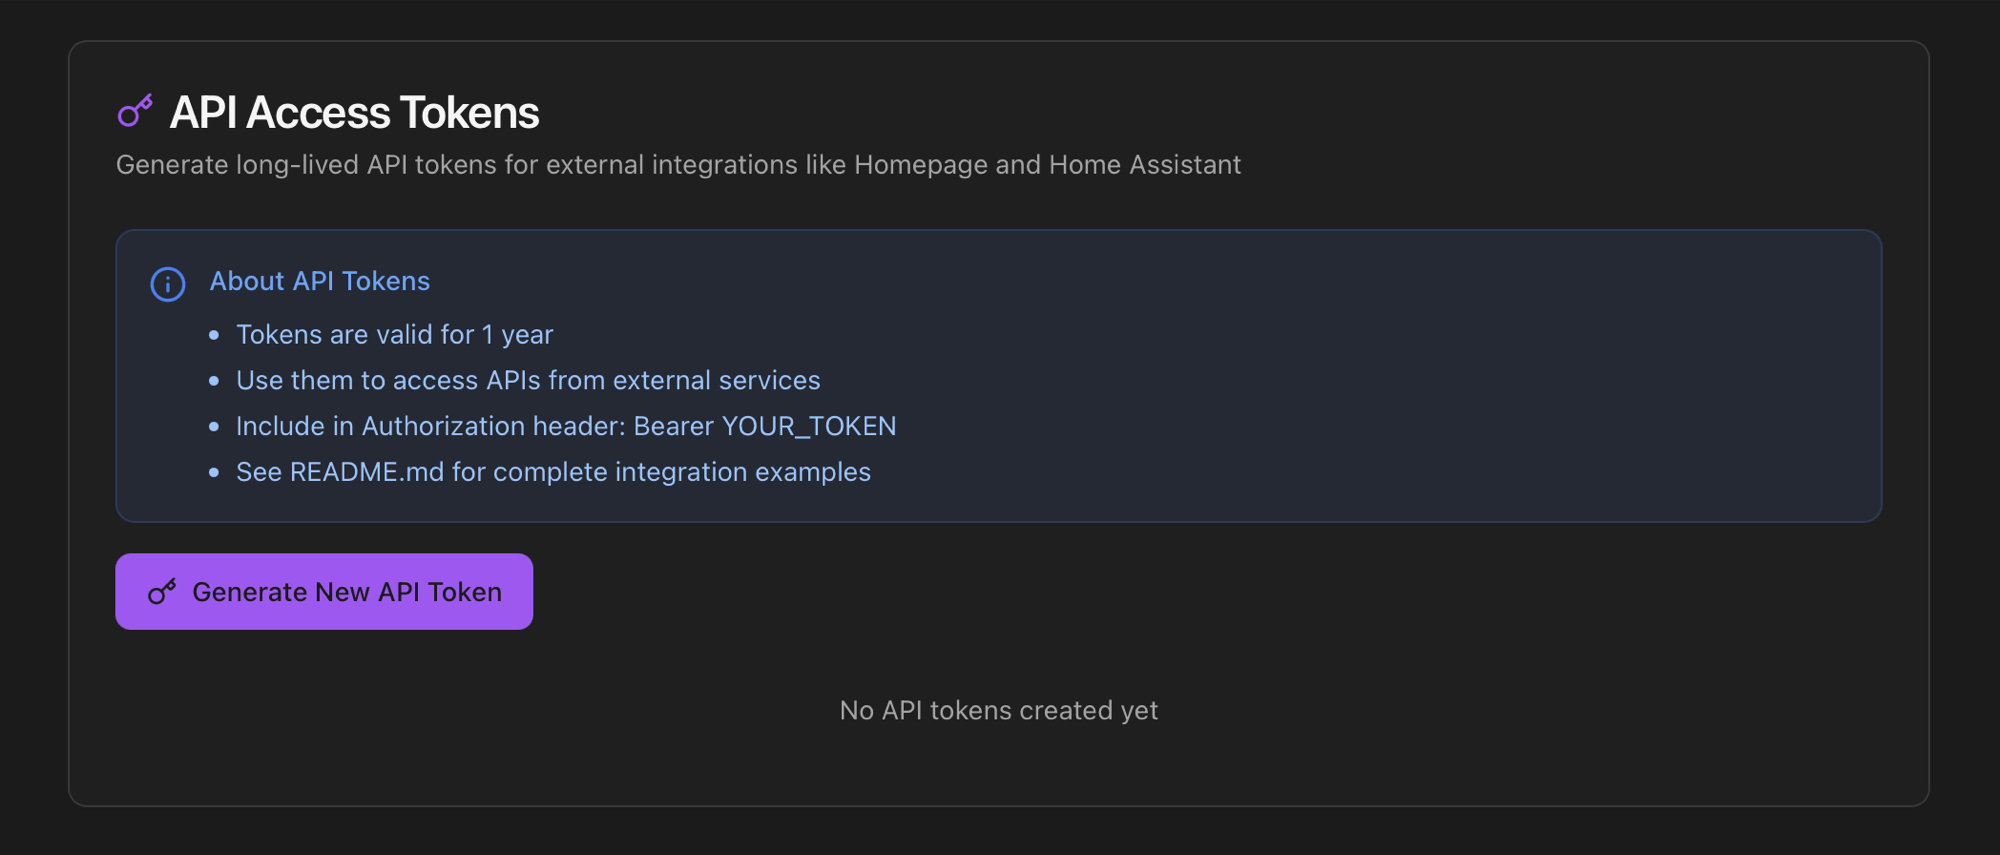
Authorization: Bearer headers.Long-lived tokens (1 year) for unattended integrations — Homepage widgets, Home Assistant REST sensors, Grafana scrapers, n8n flows, custom scripts. The card walks you through three states: empty → form → generated.
Generate a token. Click Generate New API Token. The form asks for a descriptive Token Name (helps you identify it in the active list later) and your password as second-factor confirmation. If 2FA is enabled, the form additionally asks for the current TOTP code.
Save the token immediately. The full token string is shown only once after generation. The card highlights this with an amber notice and a copy button. There's no way to retrieve it later — you'll only see the prefix in the Active Tokens list.
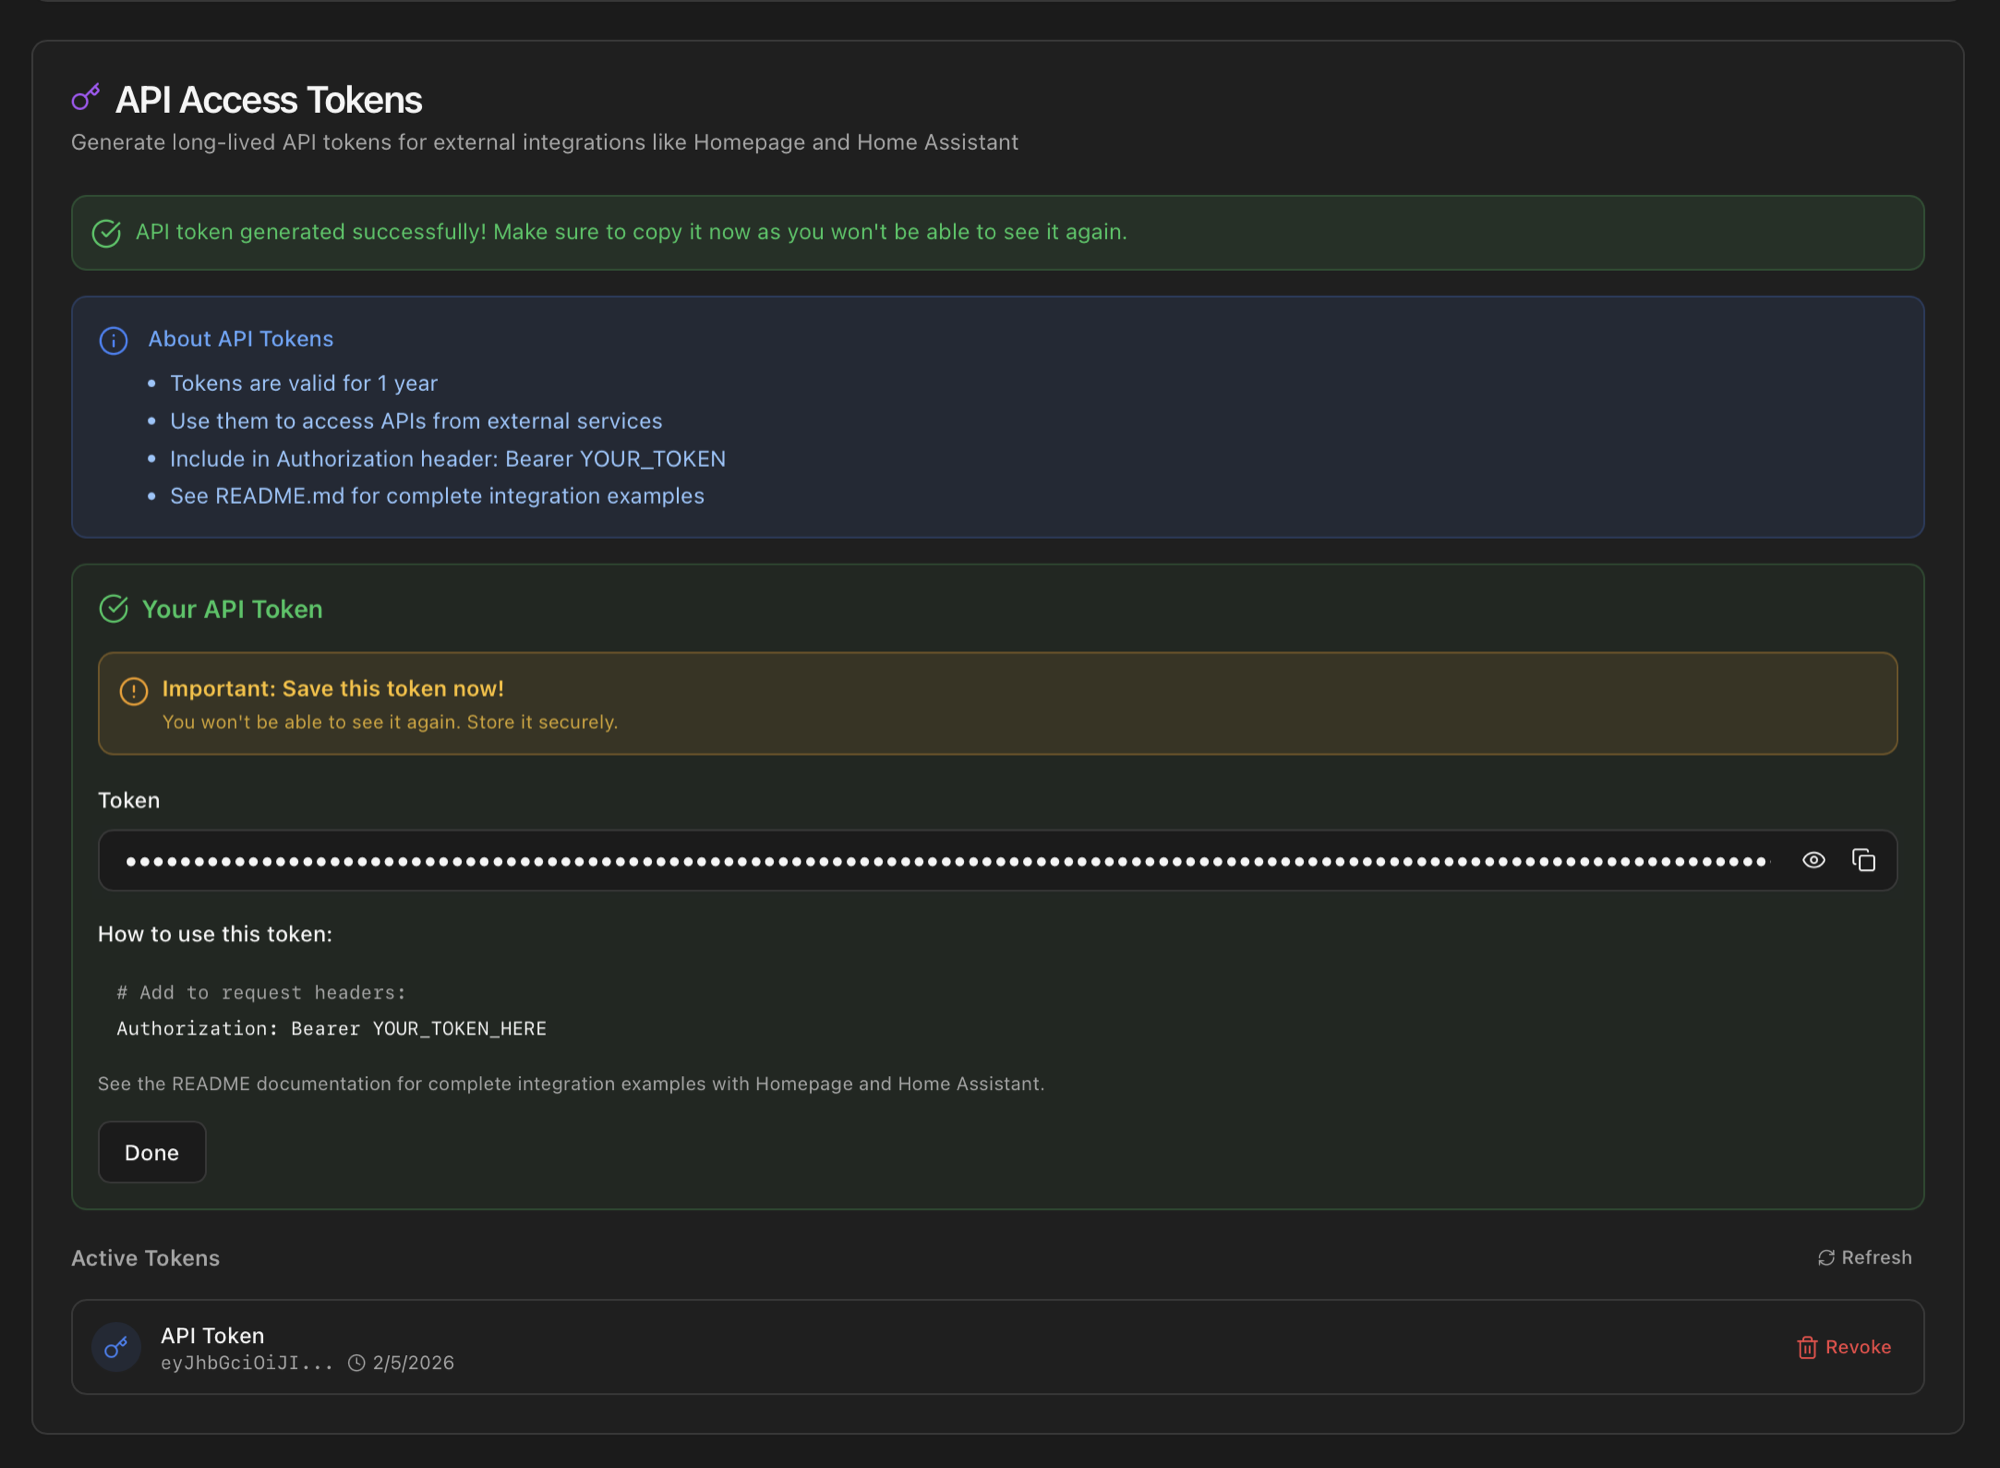
Authorization: Bearer snippet. Below, the Active Tokens list keeps name + prefix + creation date so you can revoke individual tokens later.The card shows every active token with a Revoke button per row. Revoking invalidates the token immediately; any integration using it stops working from that moment. Cookbooks for Homepage, Home Assistant, n8n and Prometheus are in Integrations.
Secure Gateway
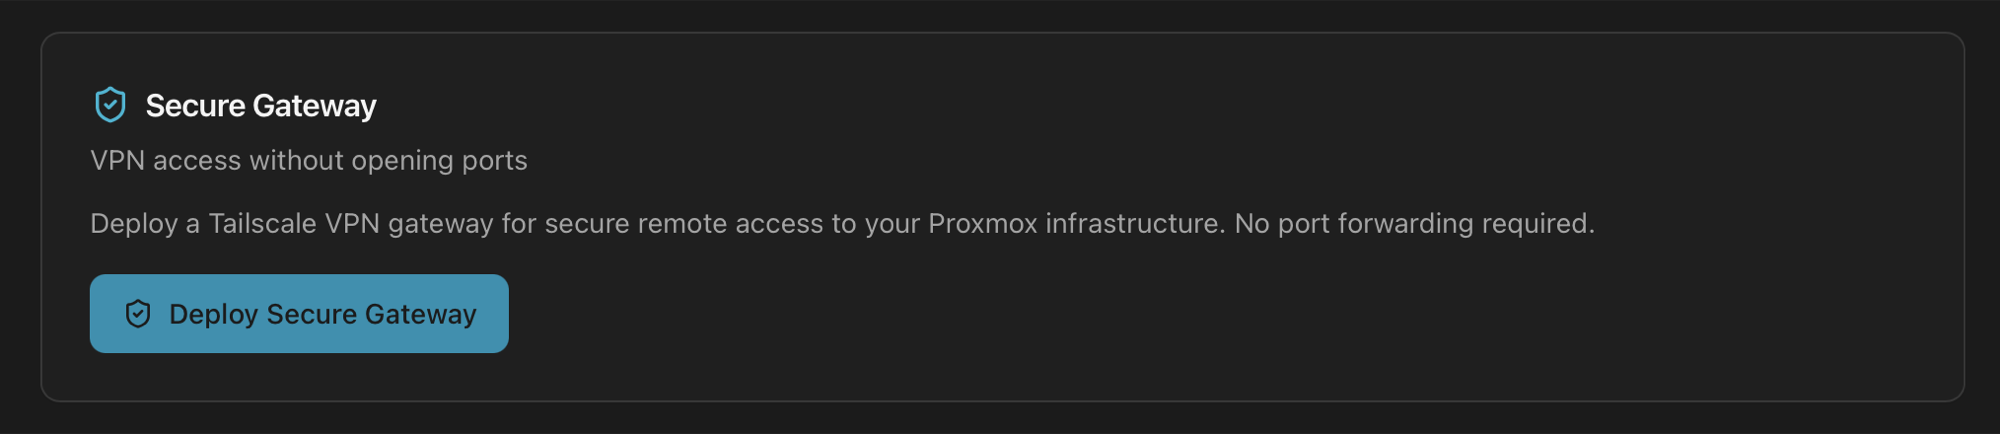
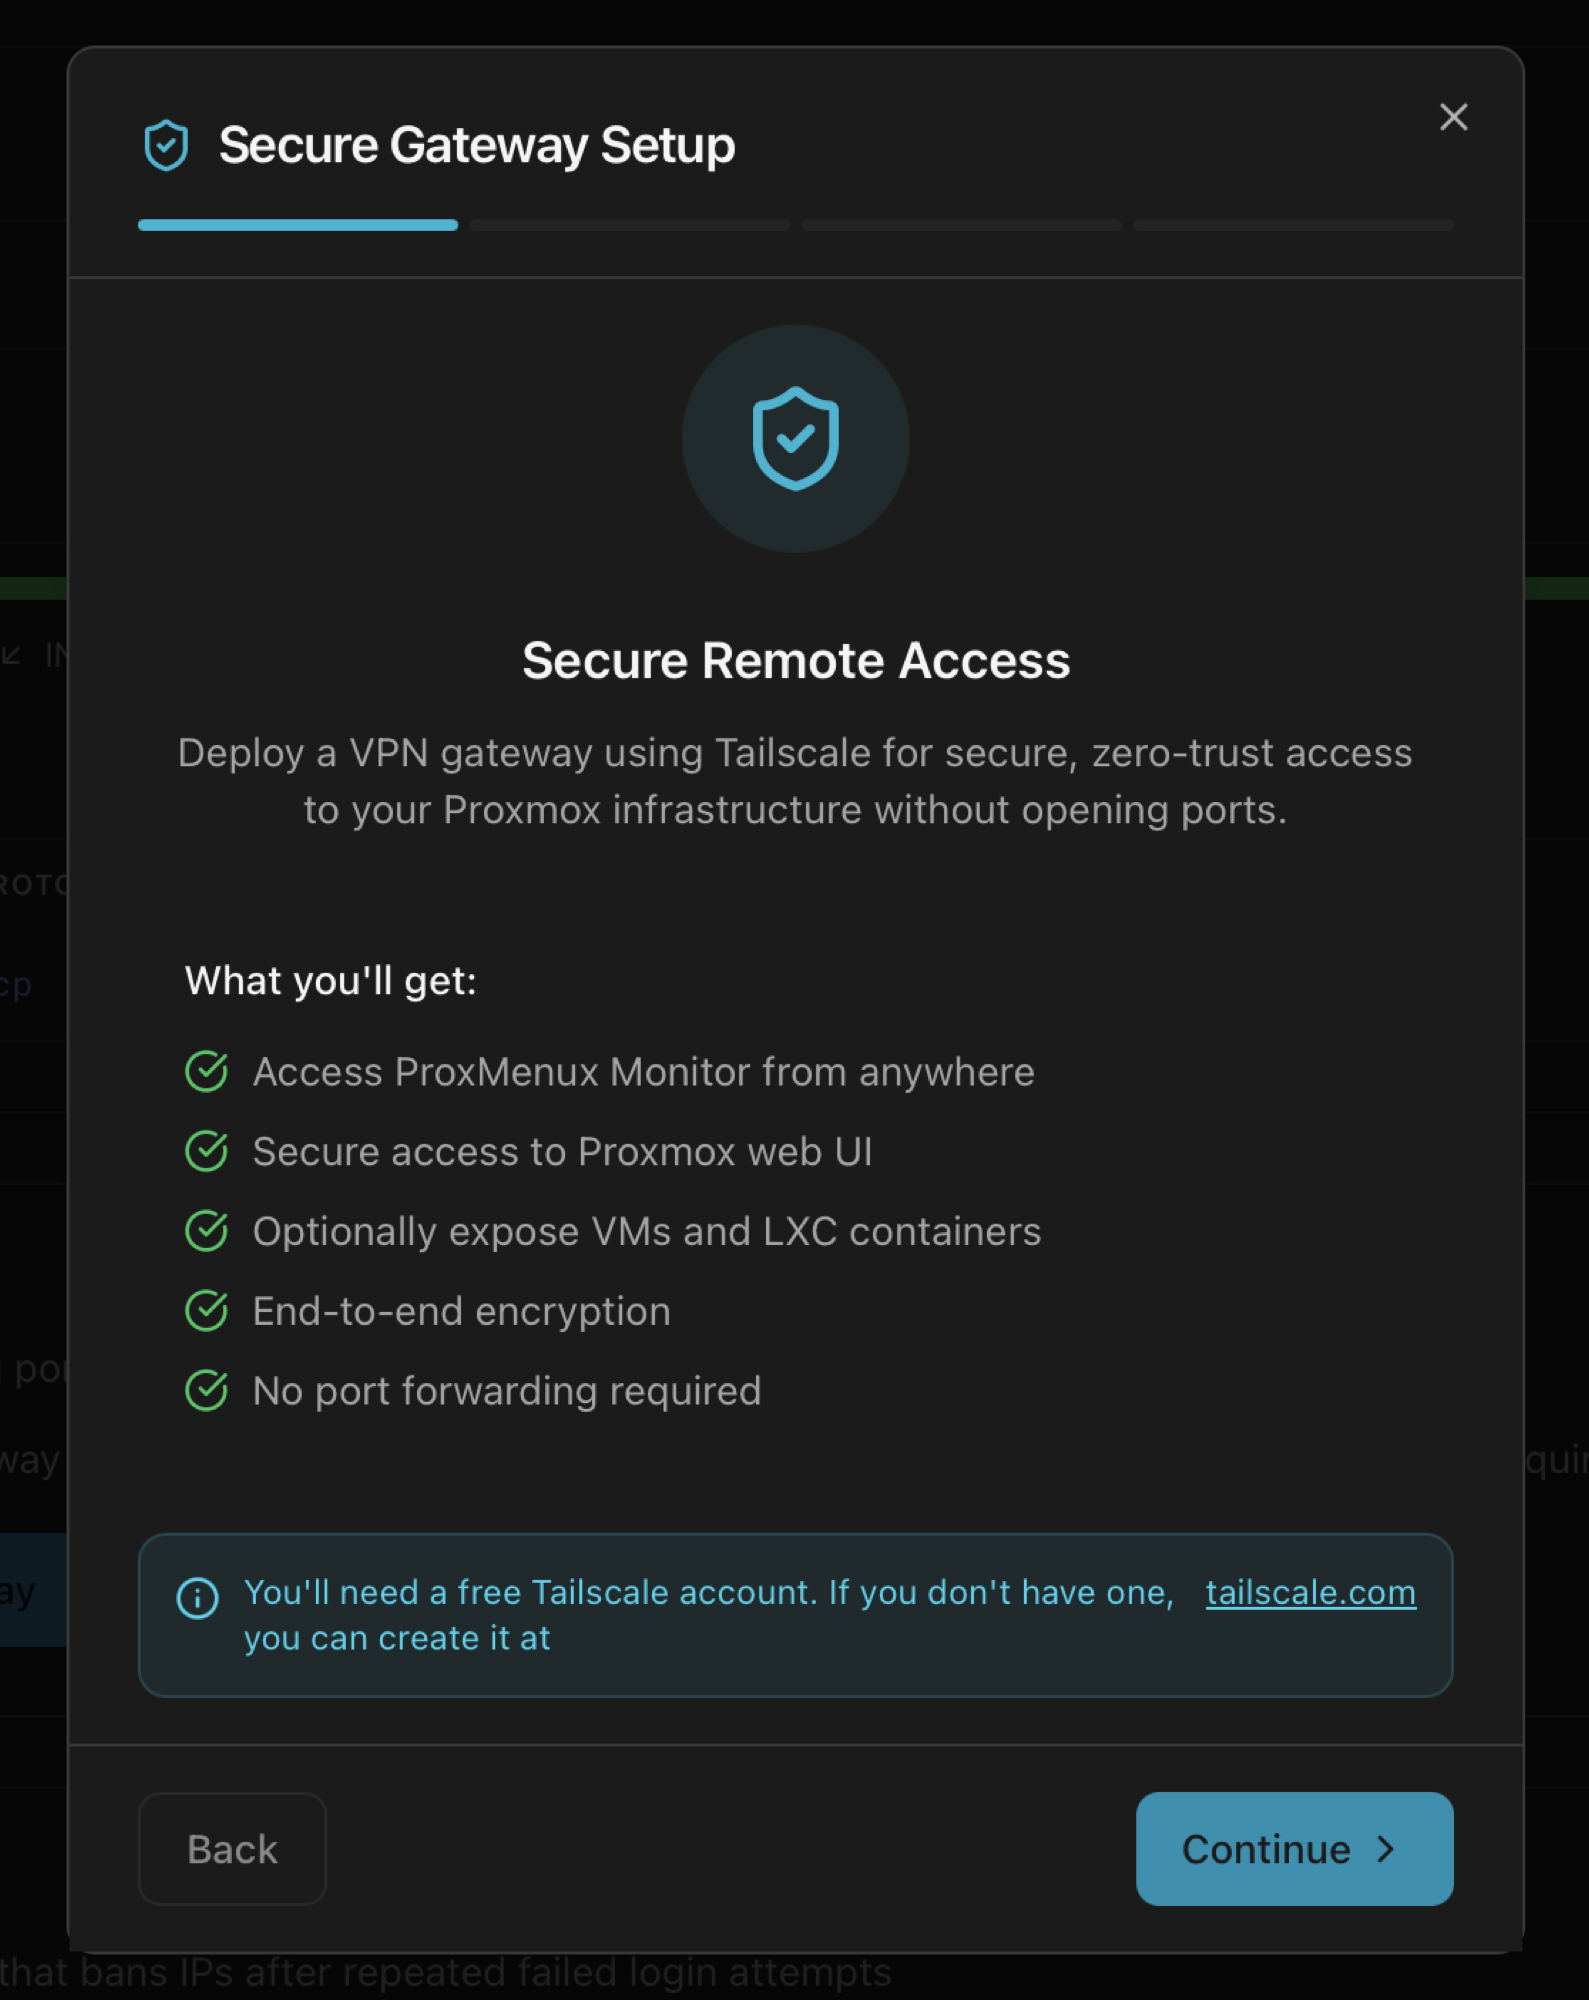
Reach the dashboard, the Proxmox web UI and any guest from anywhere on your Tailscale tailnet, without exposing any port to the public internet. The Monitor deploys an Alpine LXC container on the host running tailscaled as a subnet router; once approved in the Tailscale admin console, your remote devices reach the host's LAN IP from anywhere.
Step-by-step wizard
Before clicking Deploy Secure Gateway, generate an auth key in your Tailscale admin console — the wizard will ask for it in step 2.
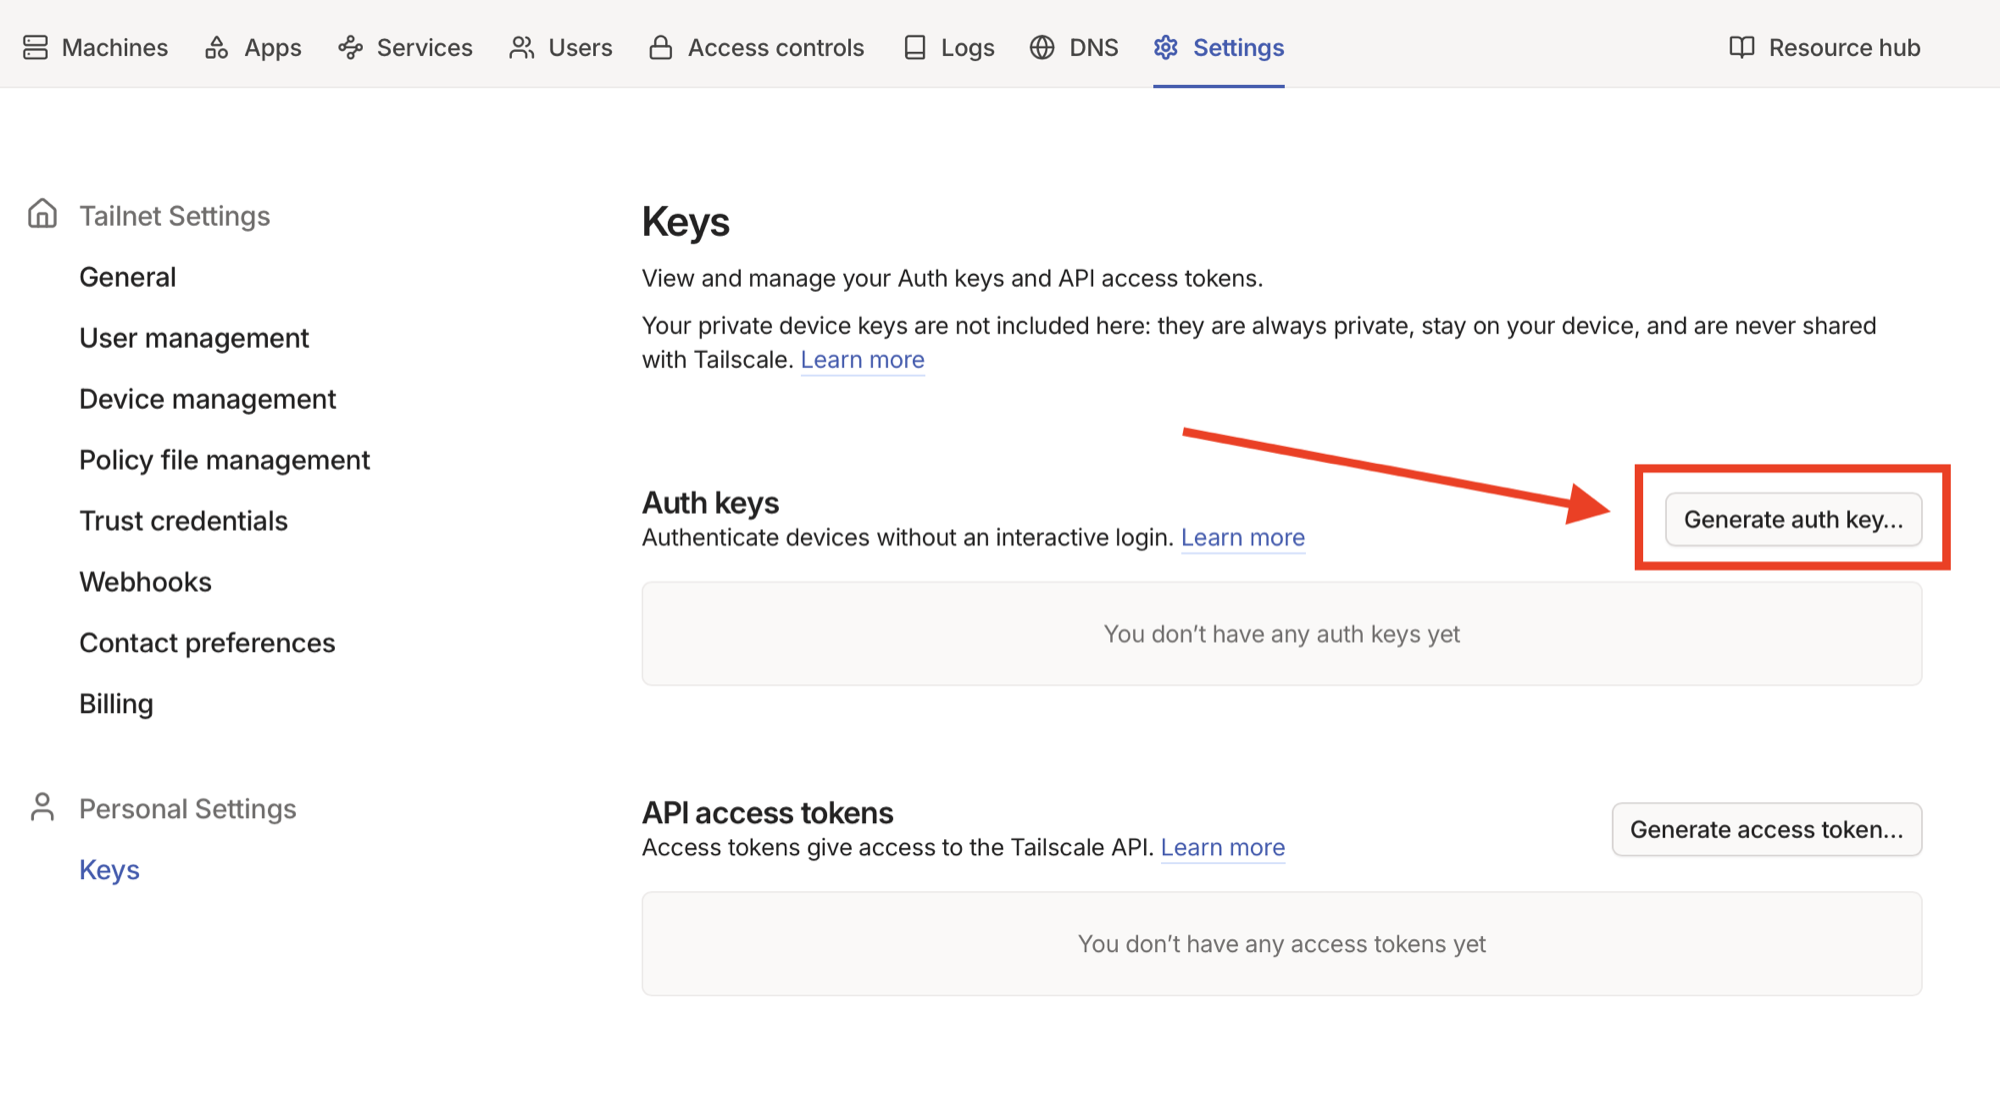
0. Generate the Tailscale auth key
Sign in to login.tailscale.com/admin/settings/keys and click Generate auth key…. Choose a pre-authenticated key (so the gateway doesn't need an interactive Tailscale login), and copy the value — it's shown only once.
1. Open the wizard
Back on the Security tab, click Deploy Secure Gateway. The first step is an intro with what you'll get and what you need.
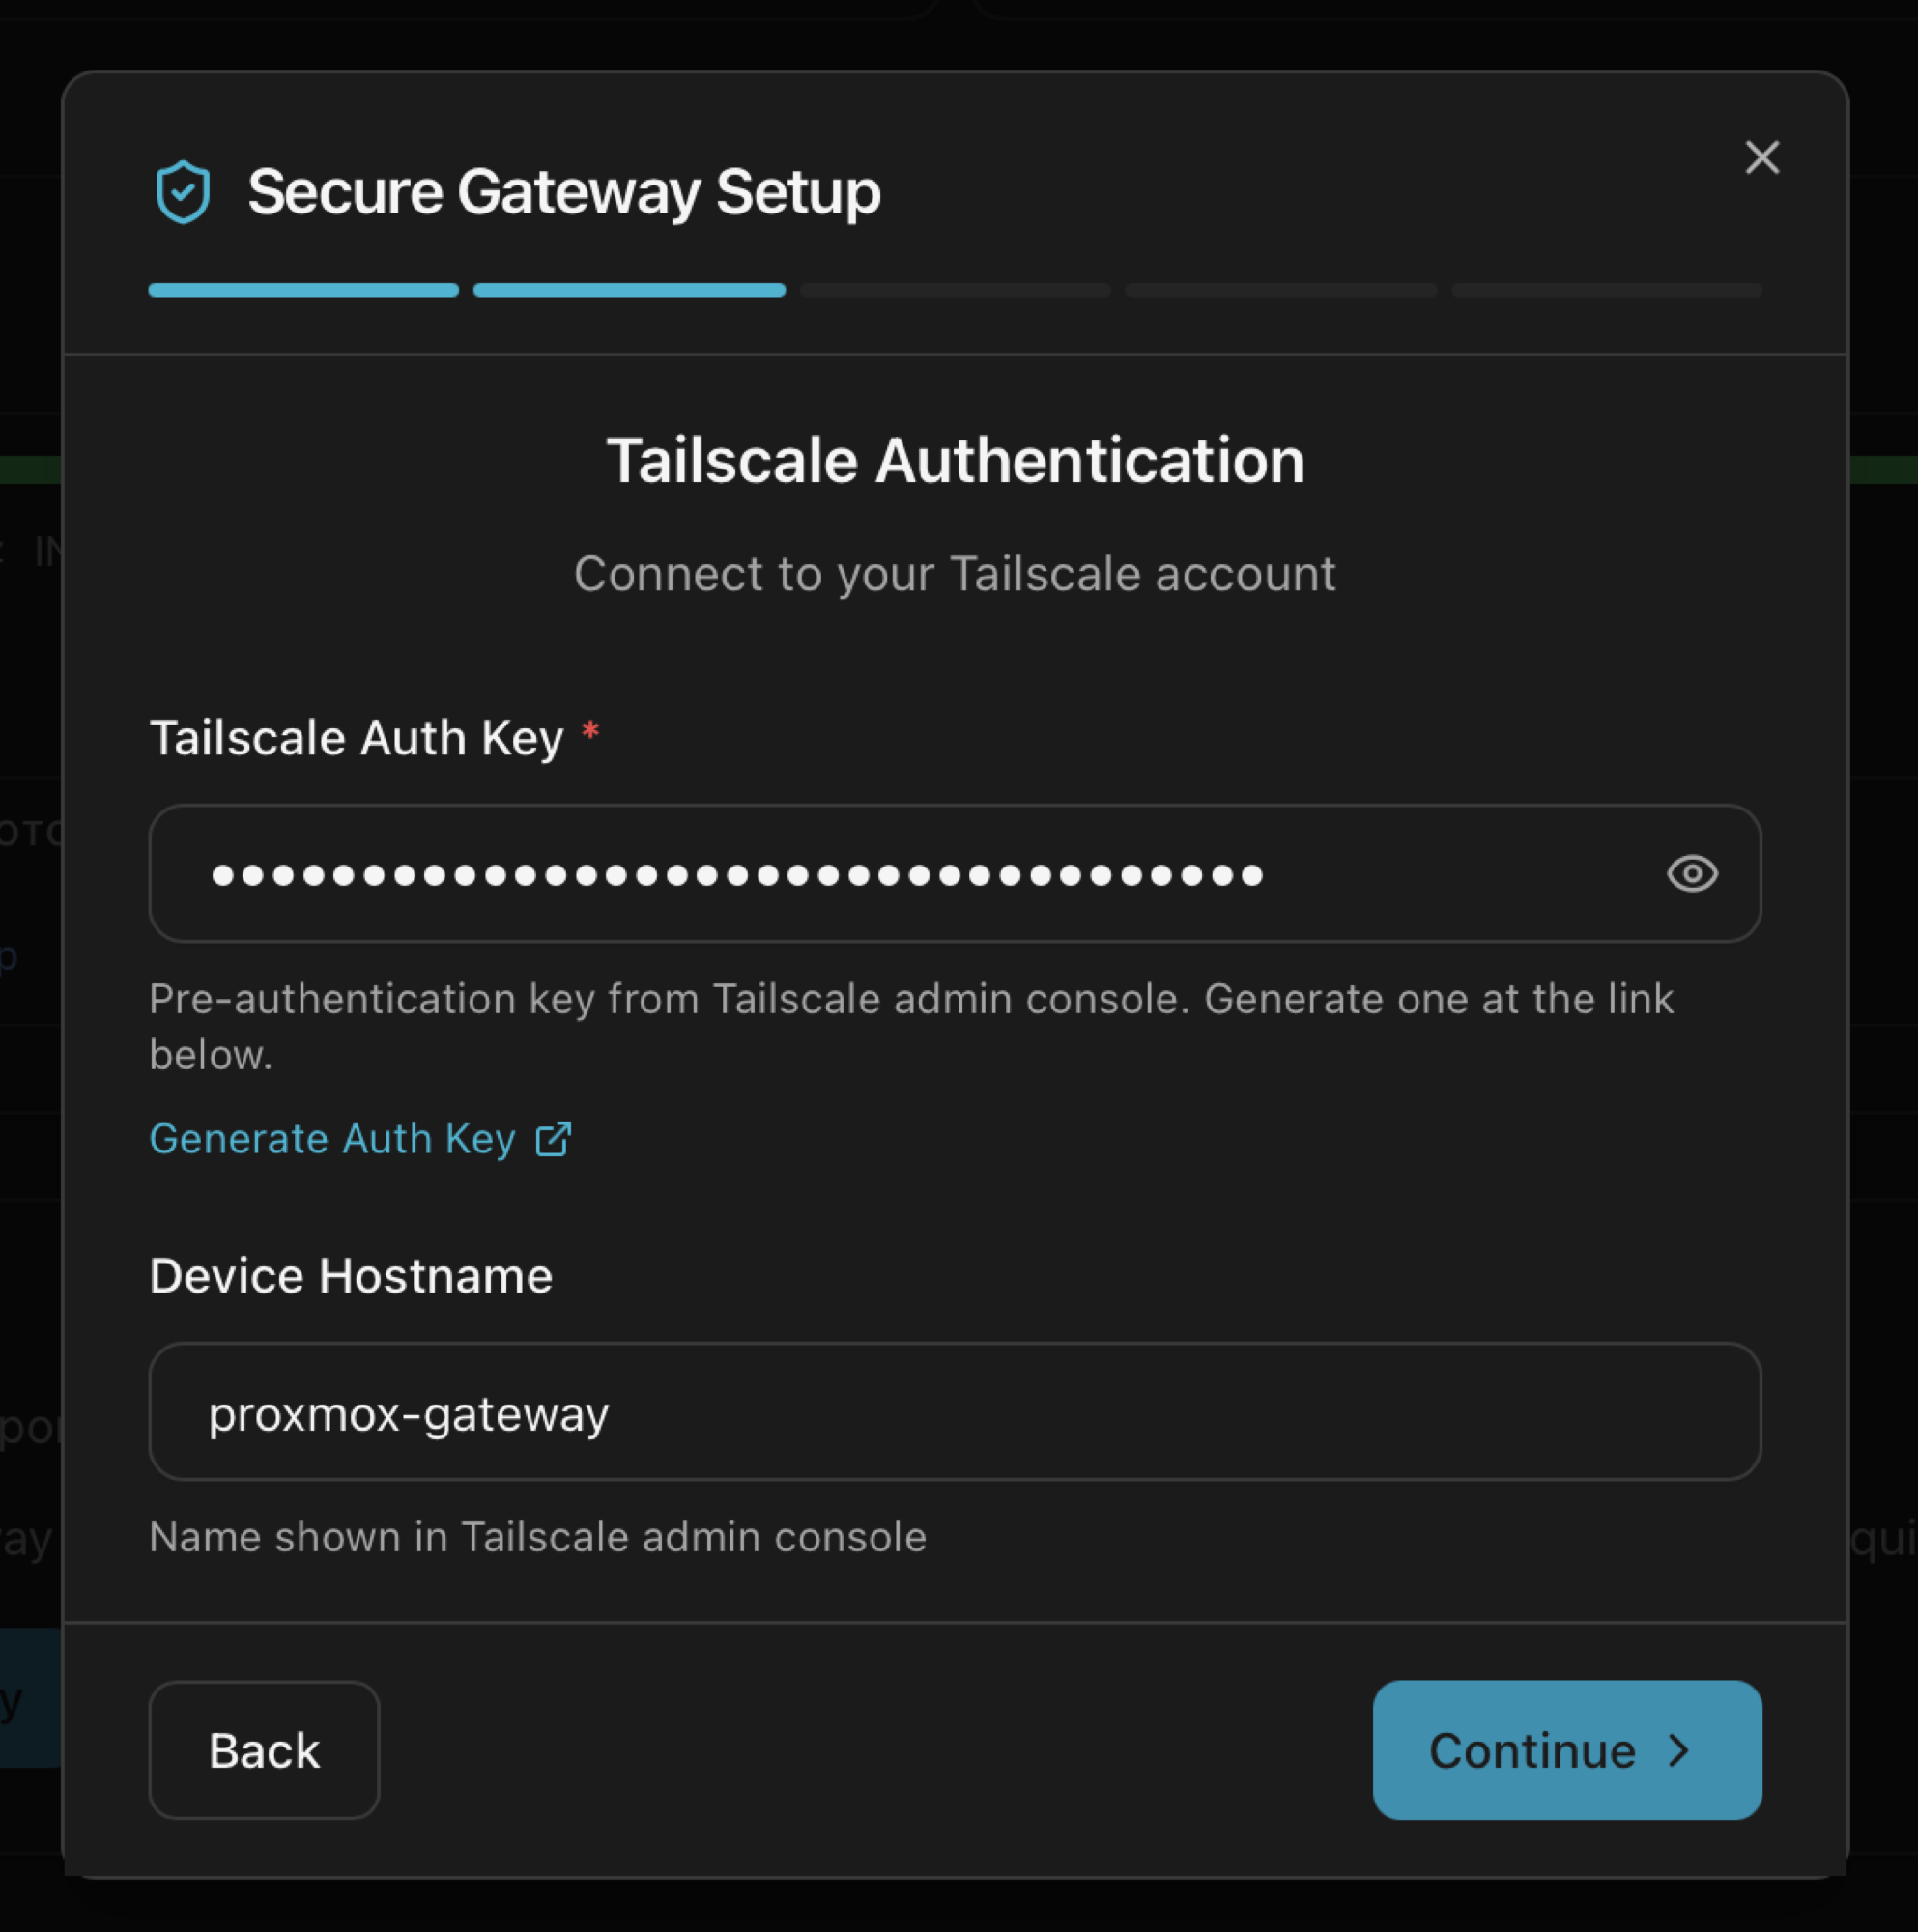
2. Tailscale Authentication
Paste the auth key from step 0 and pick a hostname (this is what the gateway will appear as in the Tailscale admin console — typically proxmox-gateway or your node name).
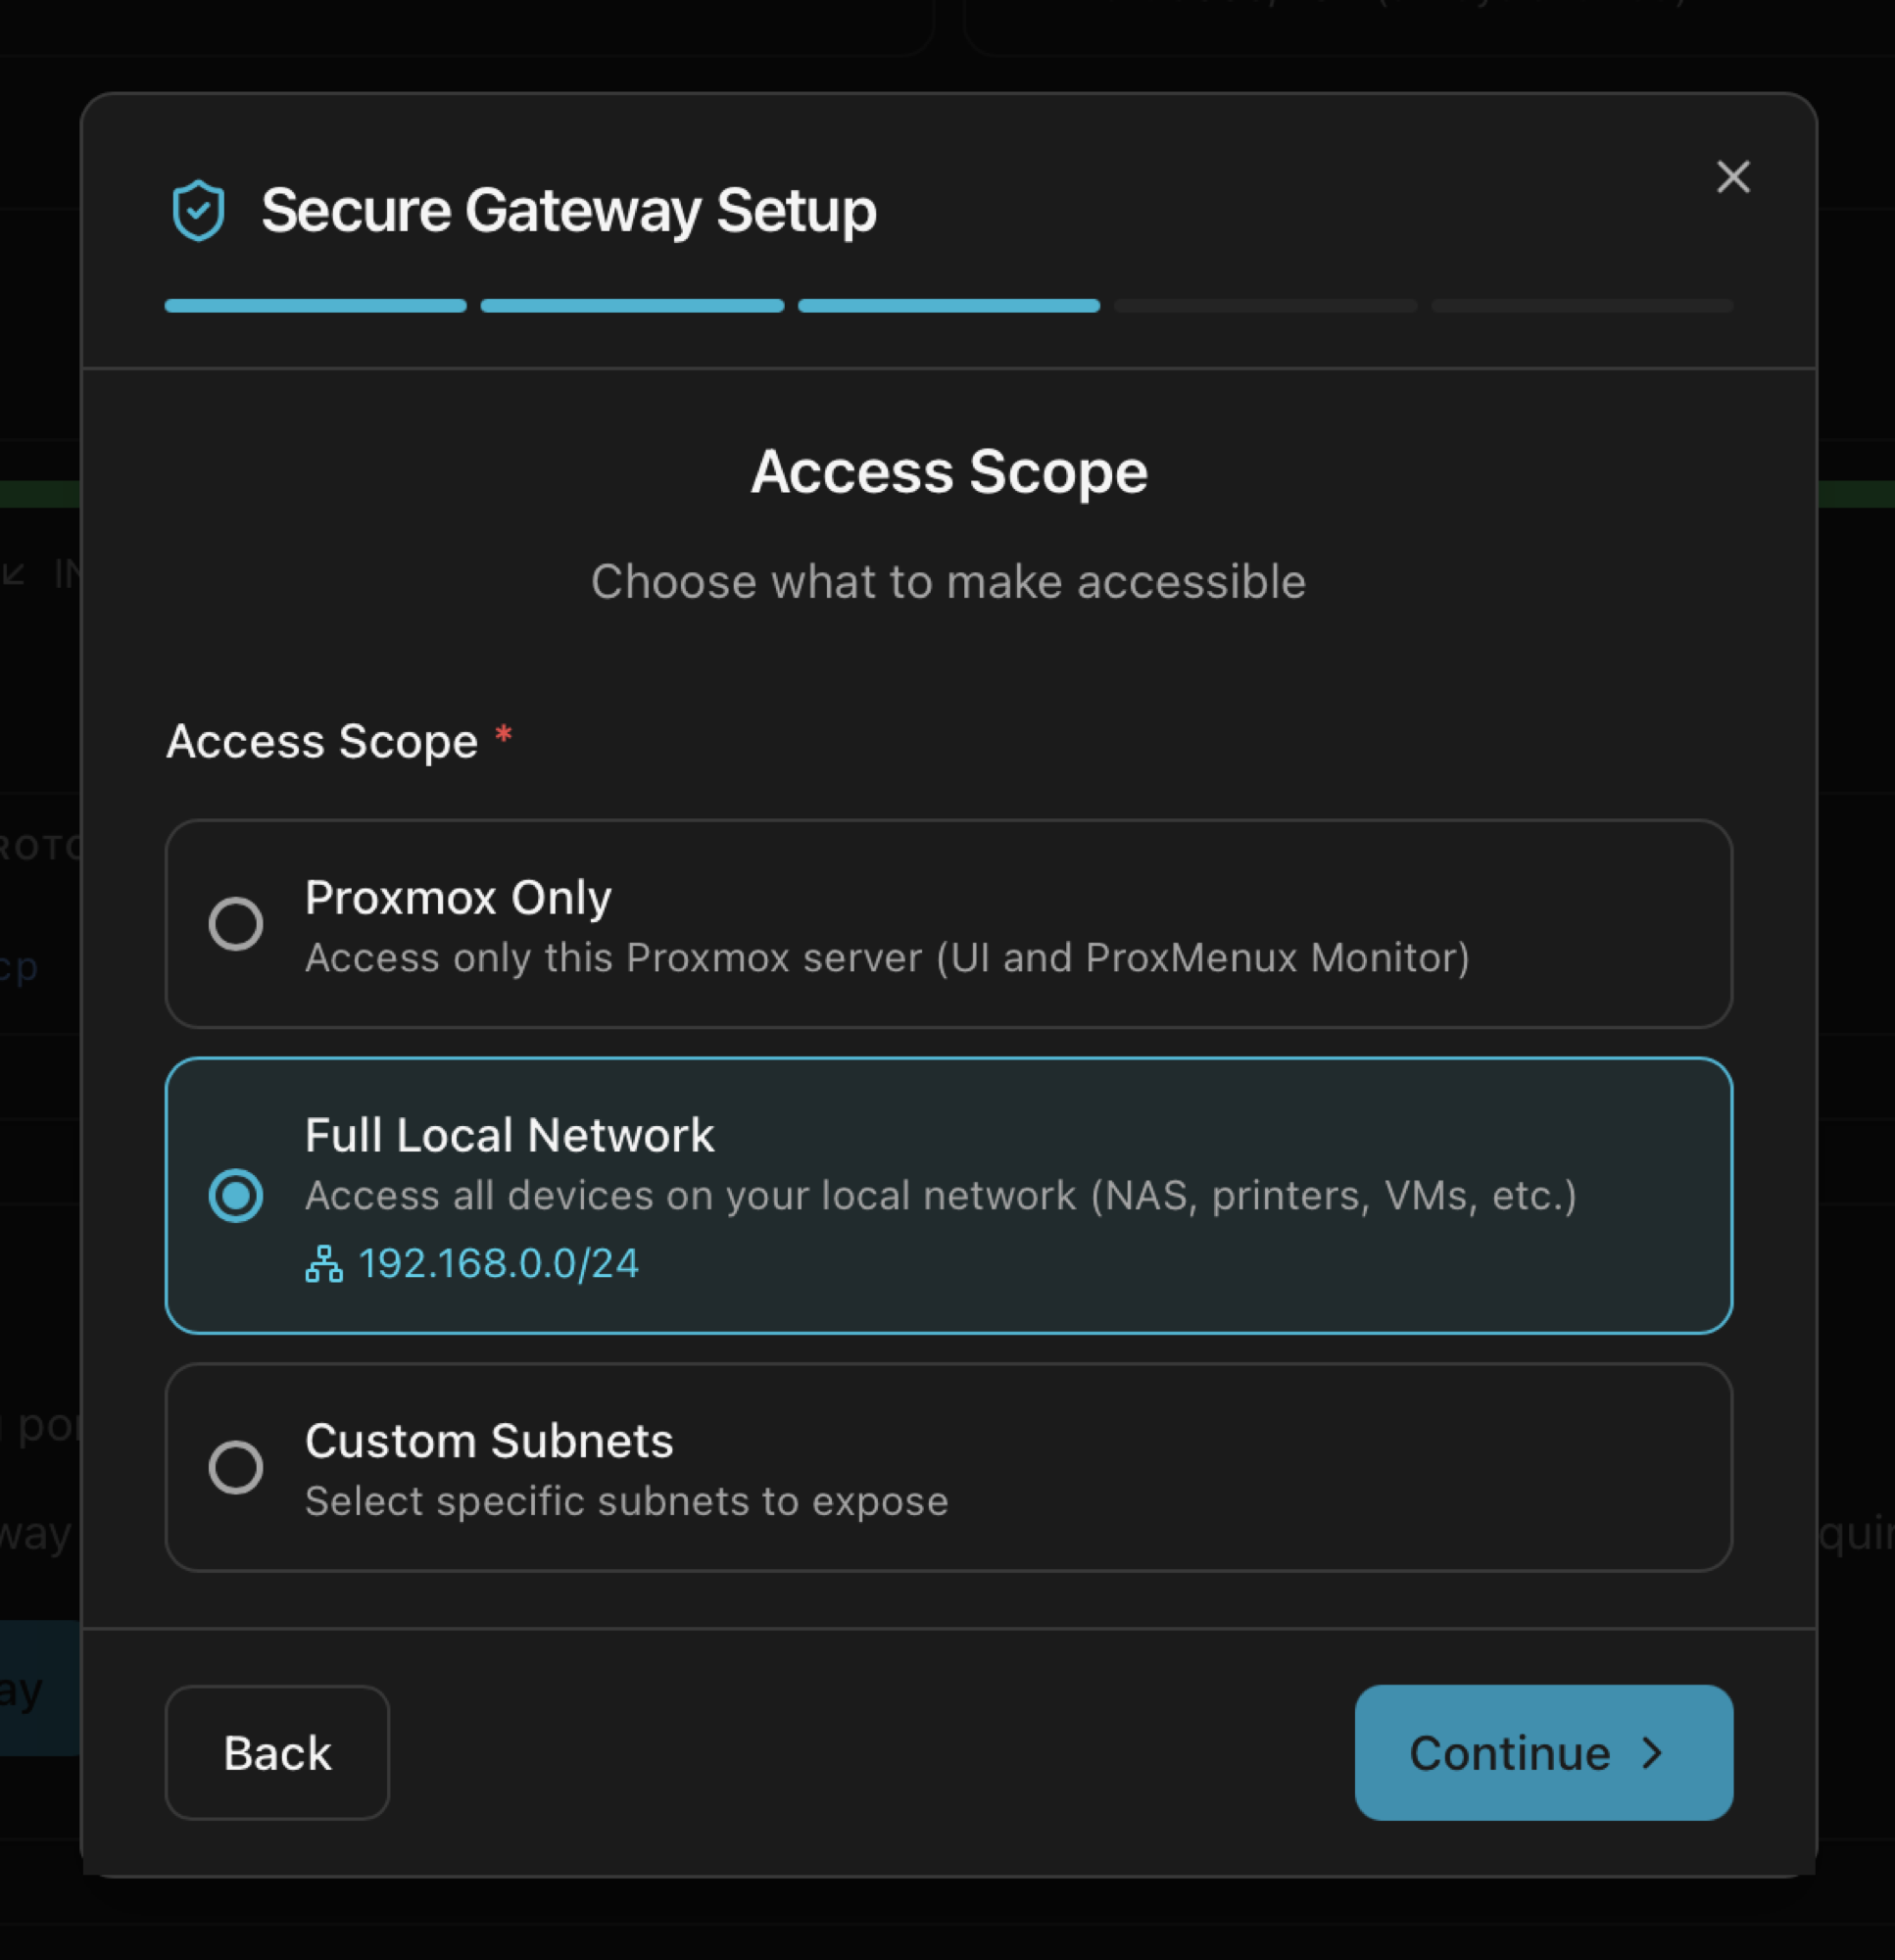
3. Access Scope
Choose what your tailnet can reach through the gateway:
- Proxmox Only — only the Proxmox UI and the Monitor. Smallest attack surface.
- Full Local Network — the entire LAN subnet (auto-detected from the host's primary interface). Lets you reach NAS, printers, VMs and any other LAN device.
- Custom Subnets — list specific CIDRs. For multi-VLAN setups where you want to expose some segments but not others.
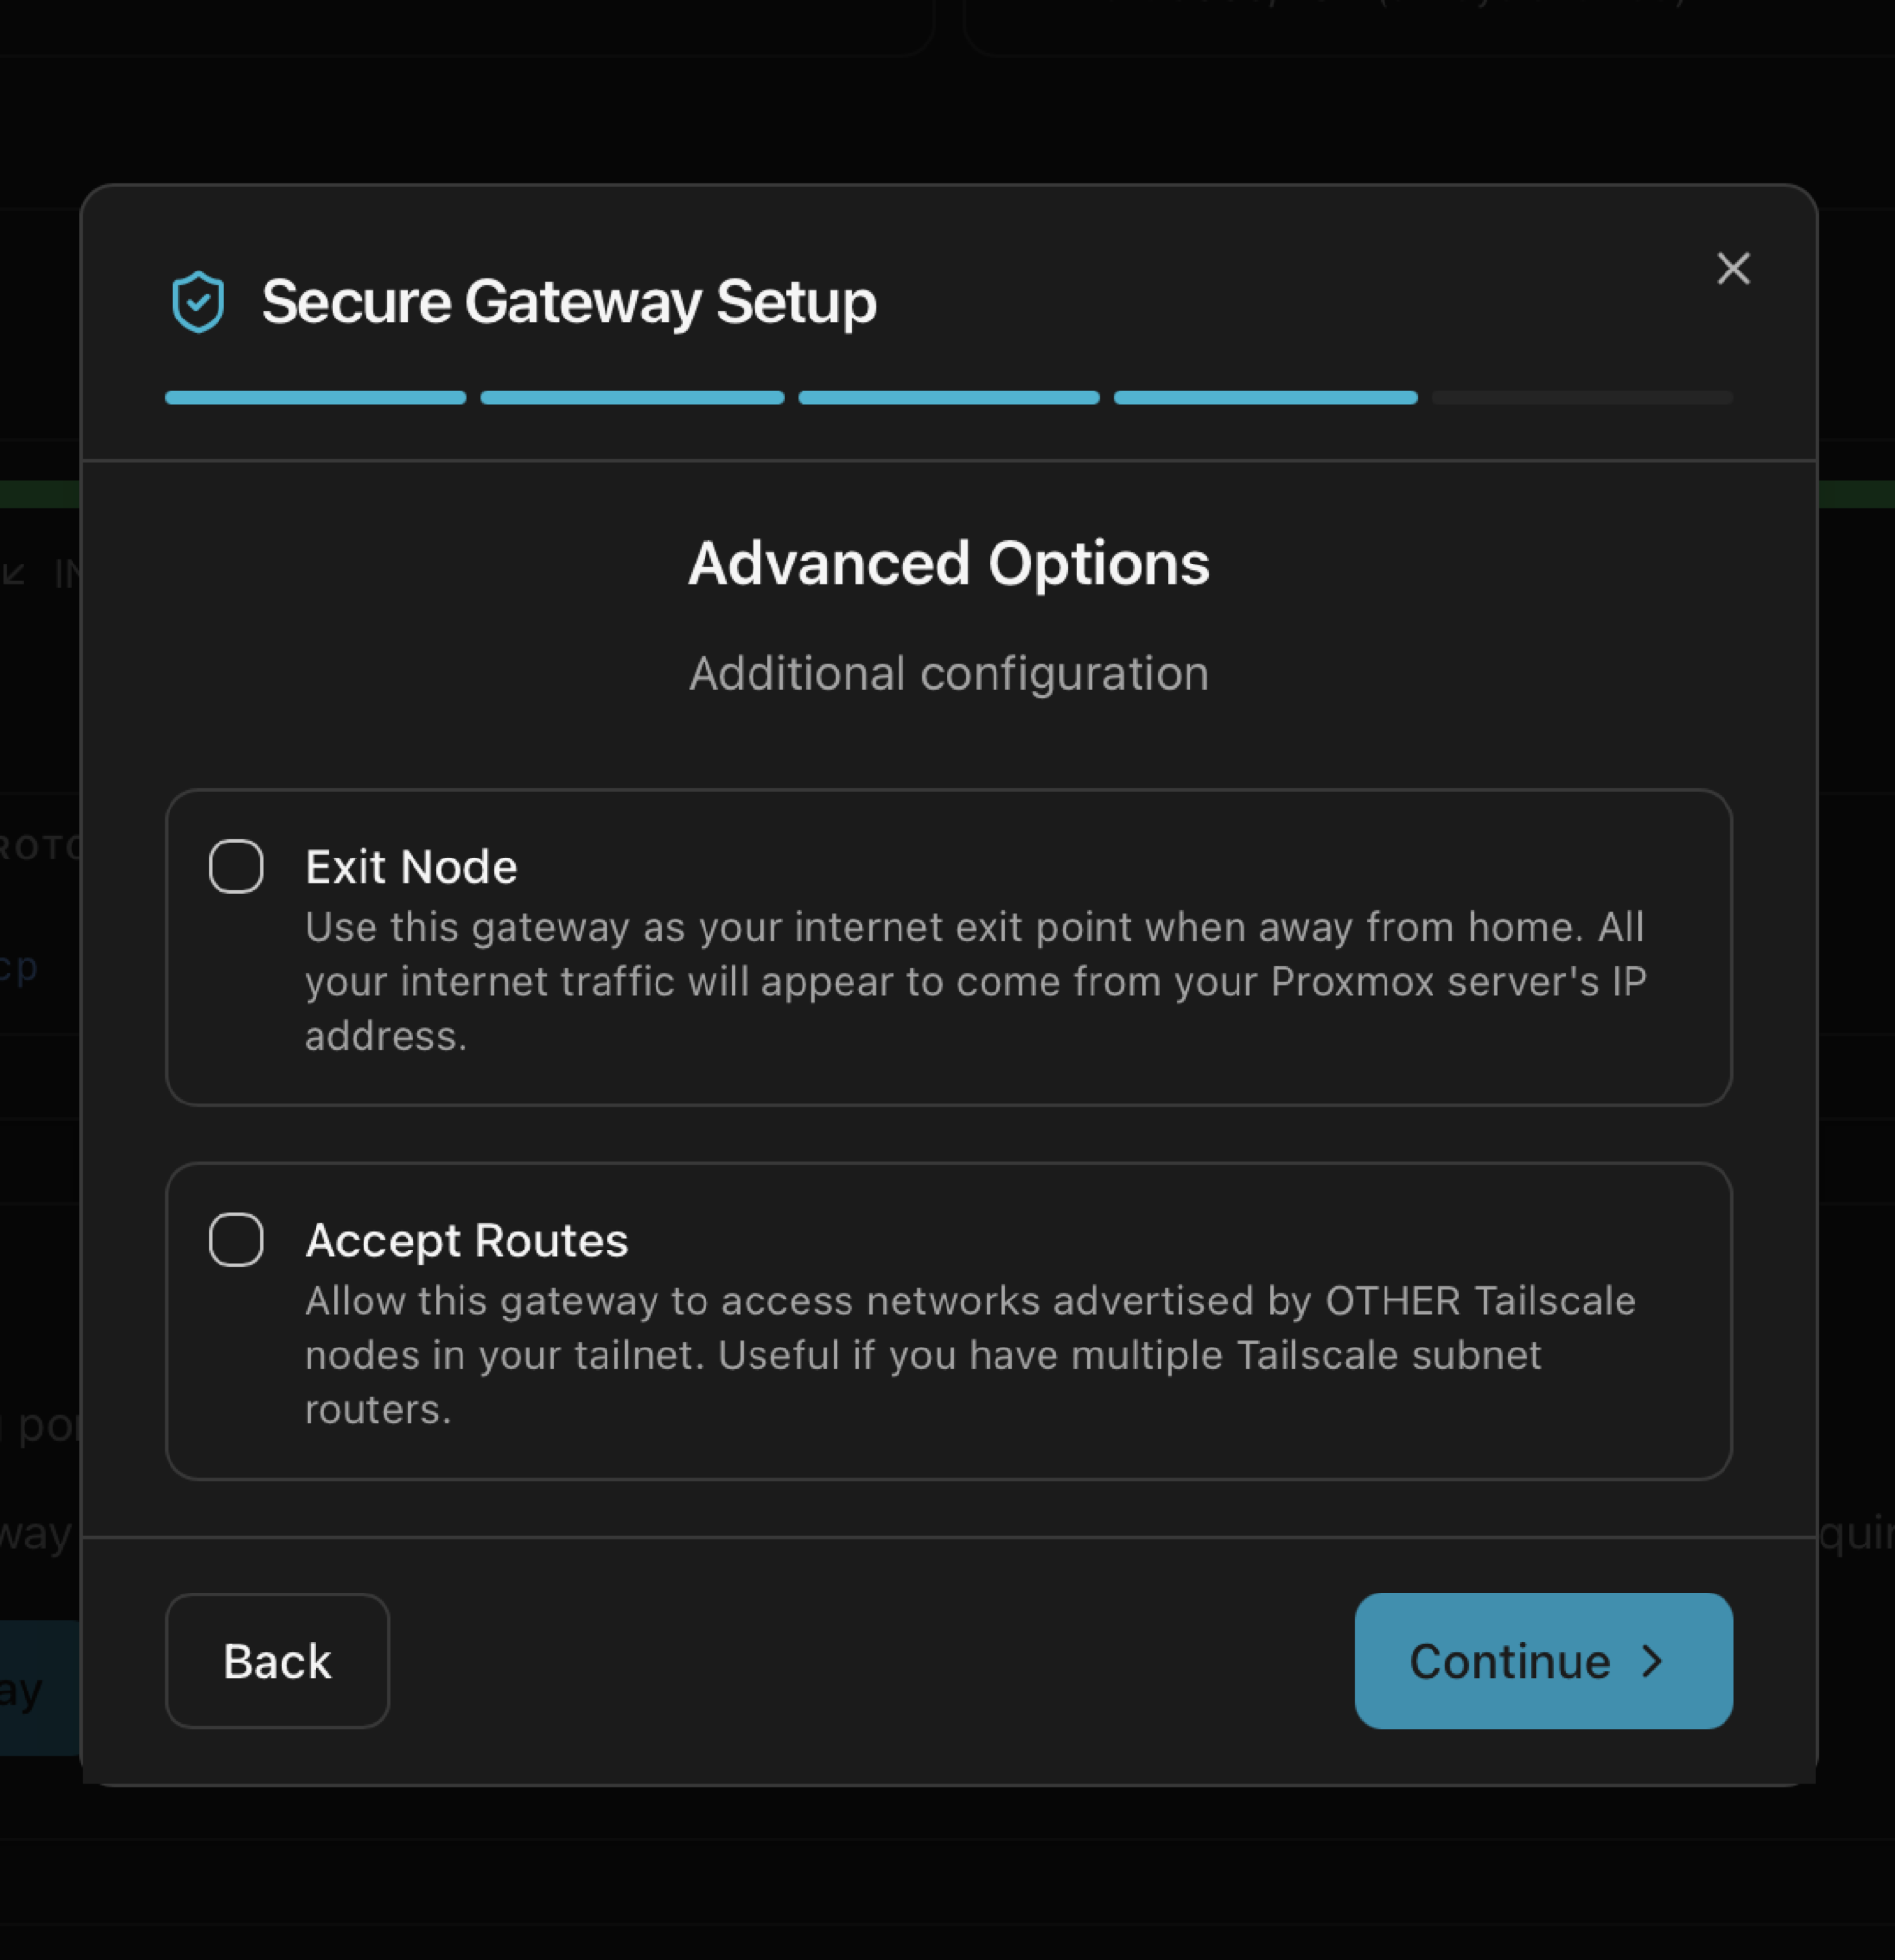
4. Advanced Options (optional)
Two optional toggles. Both are off by default:
- Exit Node — when enabled and selected from a remote device, all that device's internet traffic exits through the Proxmox host's WAN. Useful for travel scenarios where you want your phone's traffic to look like home.
- Accept Routes — let this gateway reach networks advertised by other tailnet subnet routers (for multi-site setups).
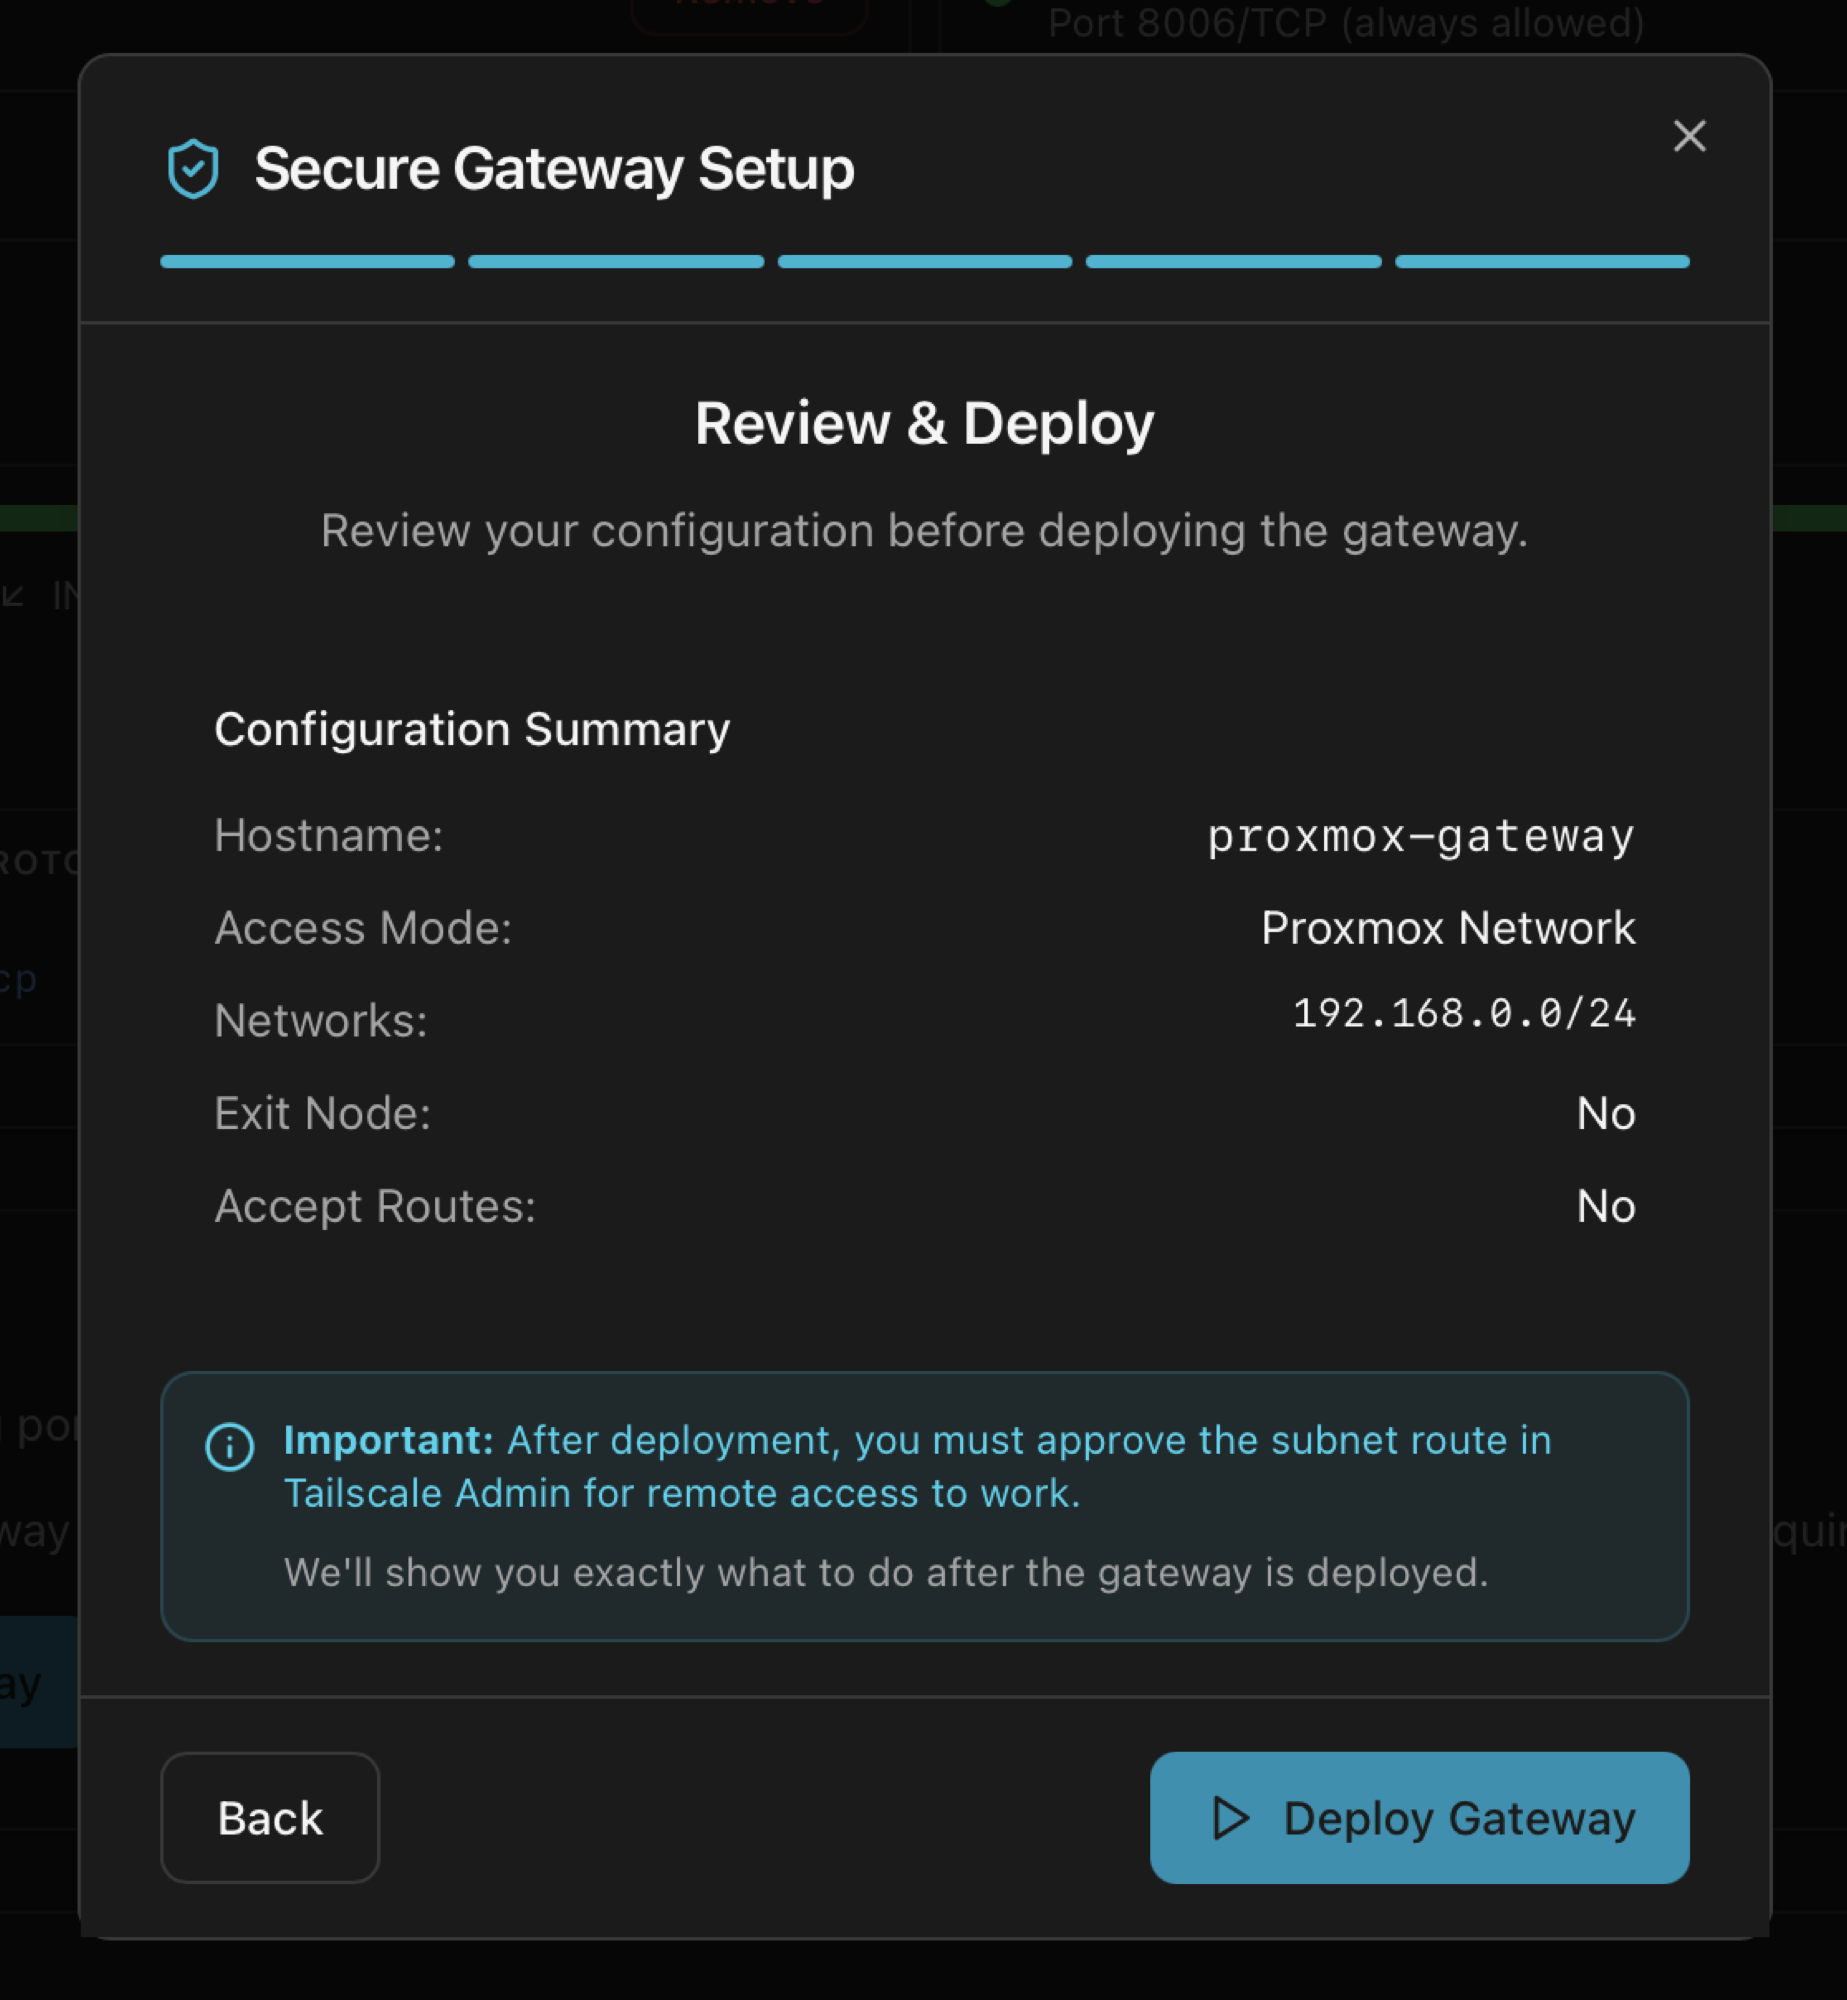
5. Review & Deploy
Final summary before the deploy starts. The wizard reminds you that one manual step in Tailscale admin is still pending after deploy: approving the subnet route.
One last manual step in Tailscale admin
Proxmox VE
The host's own protections — firewall, intrusion prevention and security audit. Last two only render when their respective tools are installed.
Proxmox Firewall
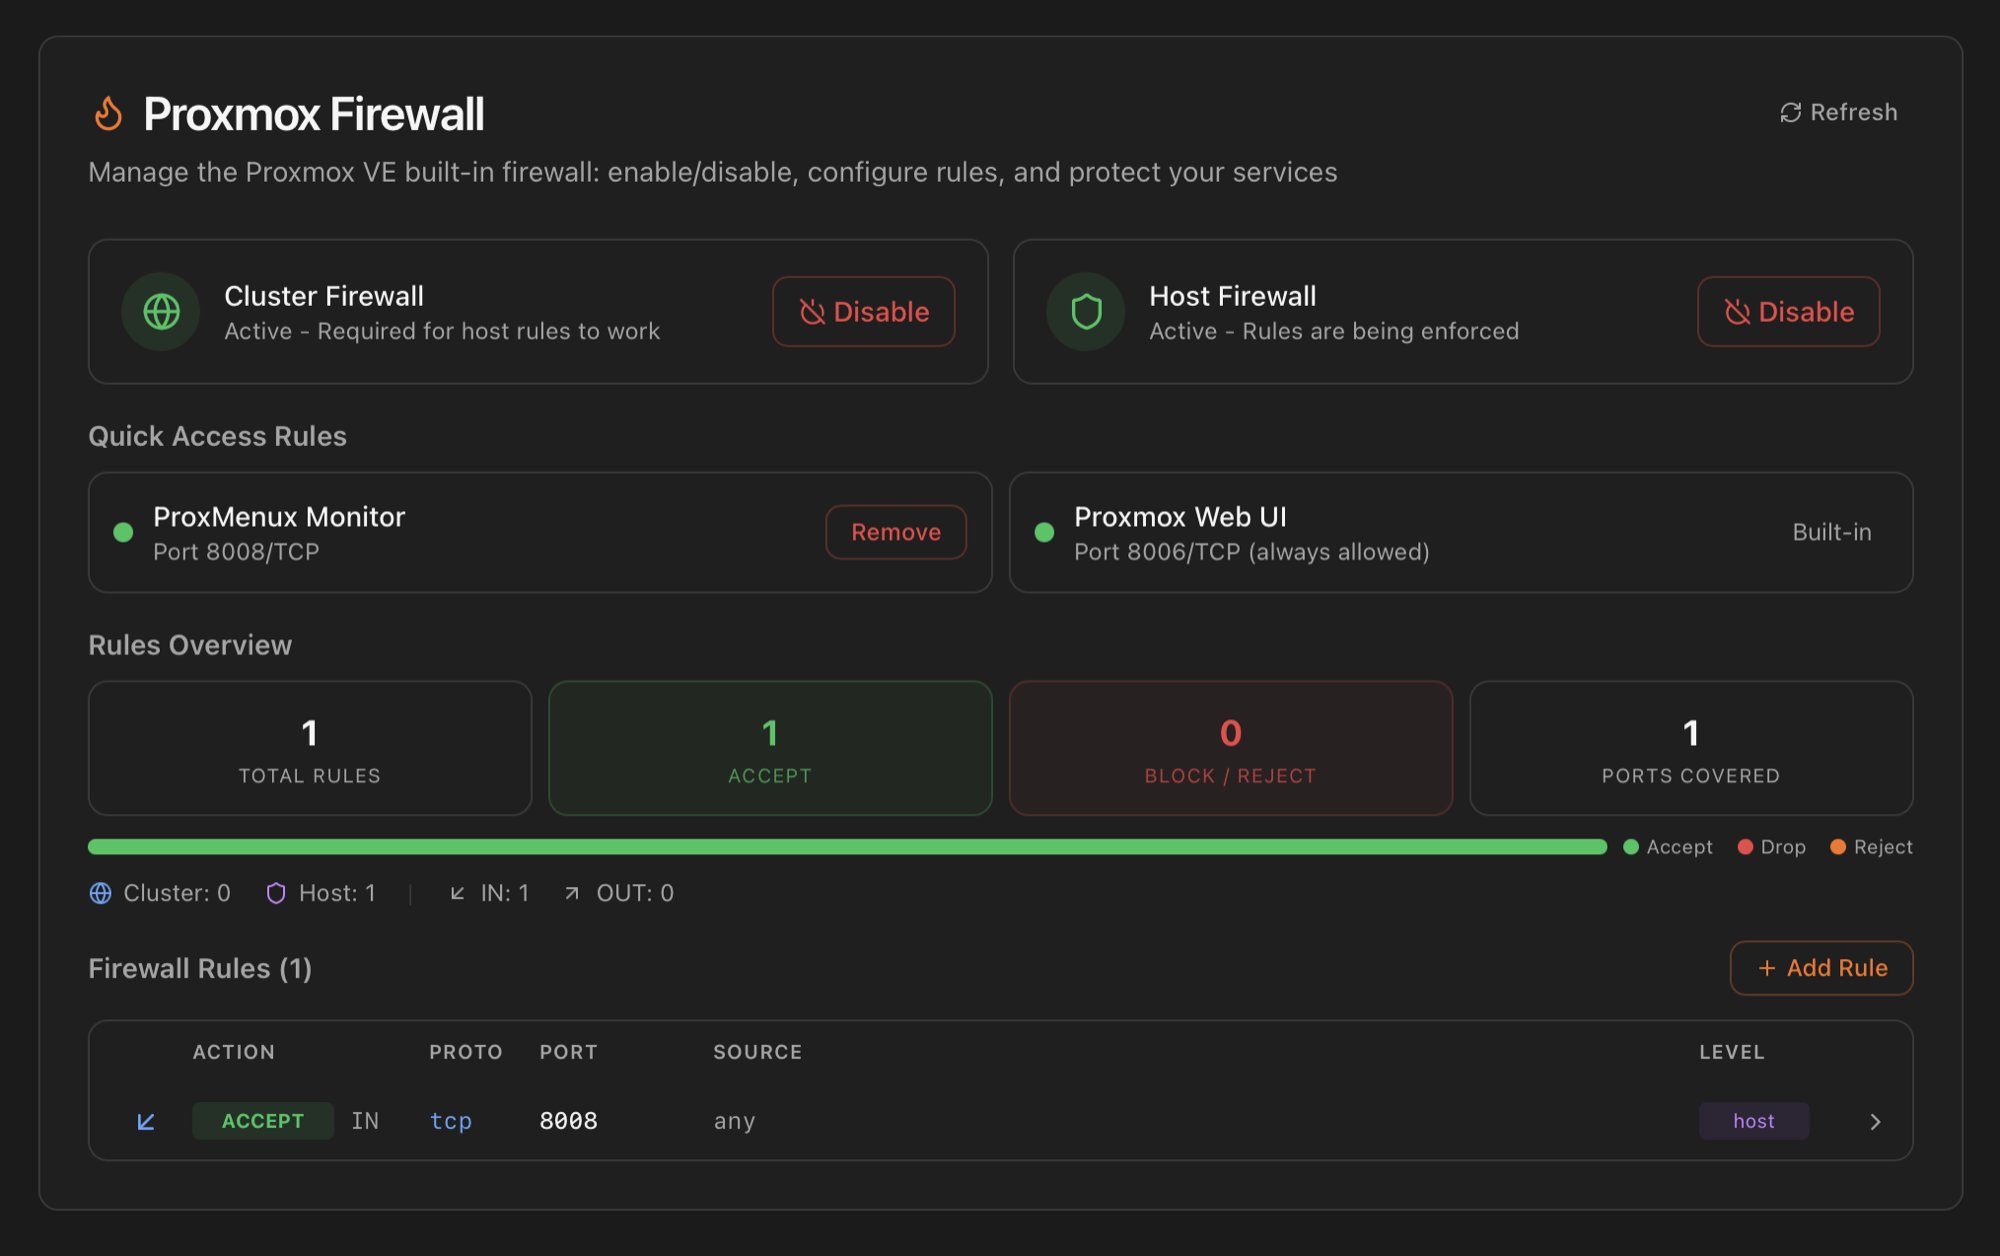
The card surfaces the Proxmox VE built-in firewall (which is independent from any host-level iptables / nftables you may run alongside). Three blocks:
- Cluster Firewall + Host Firewall — global toggles. The cluster firewall must be active for any host-level rule to take effect; the card flags this dependency inline.
- Quick Access Rules — pre-defined rows for ports that matter to ProxMenux itself:
8008/TCP(Monitor),8006/TCP(Proxmox Web UI). Each row shows the current allow / deny / unprotected state. The Proxmox Web UI is allowed via the built-in Proxmox firewall macro and can't be removed accidentally. - Rules Overview — counters for total rules, accept rules, drop / reject rules and distinct ports protected. Numbers are read from
/etc/pve/firewall/cluster.fwand/etc/pve/nodes/<node>/host.fw. - Firewall Rules — full list with action / protocol / port / source / level. + Add Rule opens an inline editor; the trash icon on each row removes the rule. Edits write to the same files Proxmox uses, so changes also appear in the Proxmox UI (Datacenter / Node → Firewall).
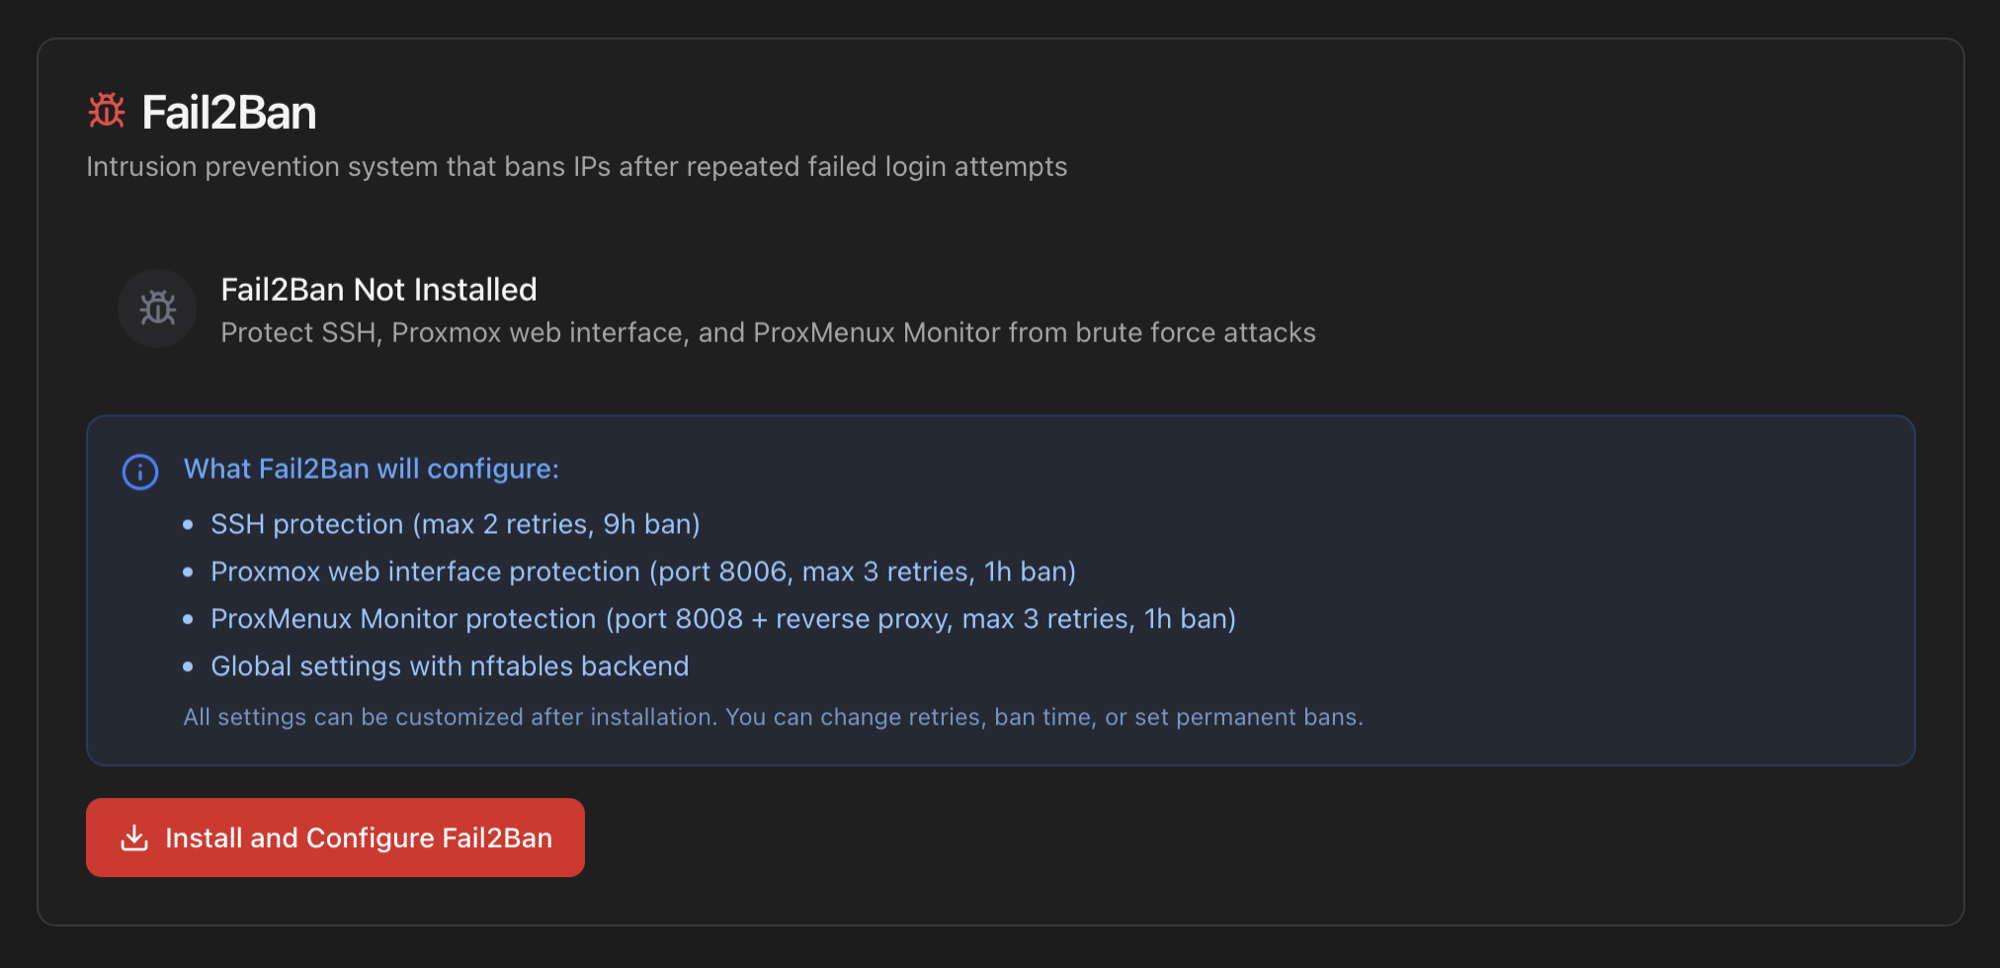
Fail2Ban (conditional)
What it is. Fail2Ban is an open-source intrusion-prevention daemon that watches log files for repeated failed login attempts and bans the offending IP at the firewall level. It's the de-facto answer to brute-force scanners that hit SSH and web login forms 24/7. ProxMenux wires it to three jails by default: SSH, the Proxmox web UI login (port 8006), and the ProxMenux Monitor login (port 8008).
Fail2Ban is not bundled. The card detects whether it's installed and adapts: when missing it offers a one-click install; once installed it shows live jail status, banned IPs and lets you tune retries / ban time per jail.
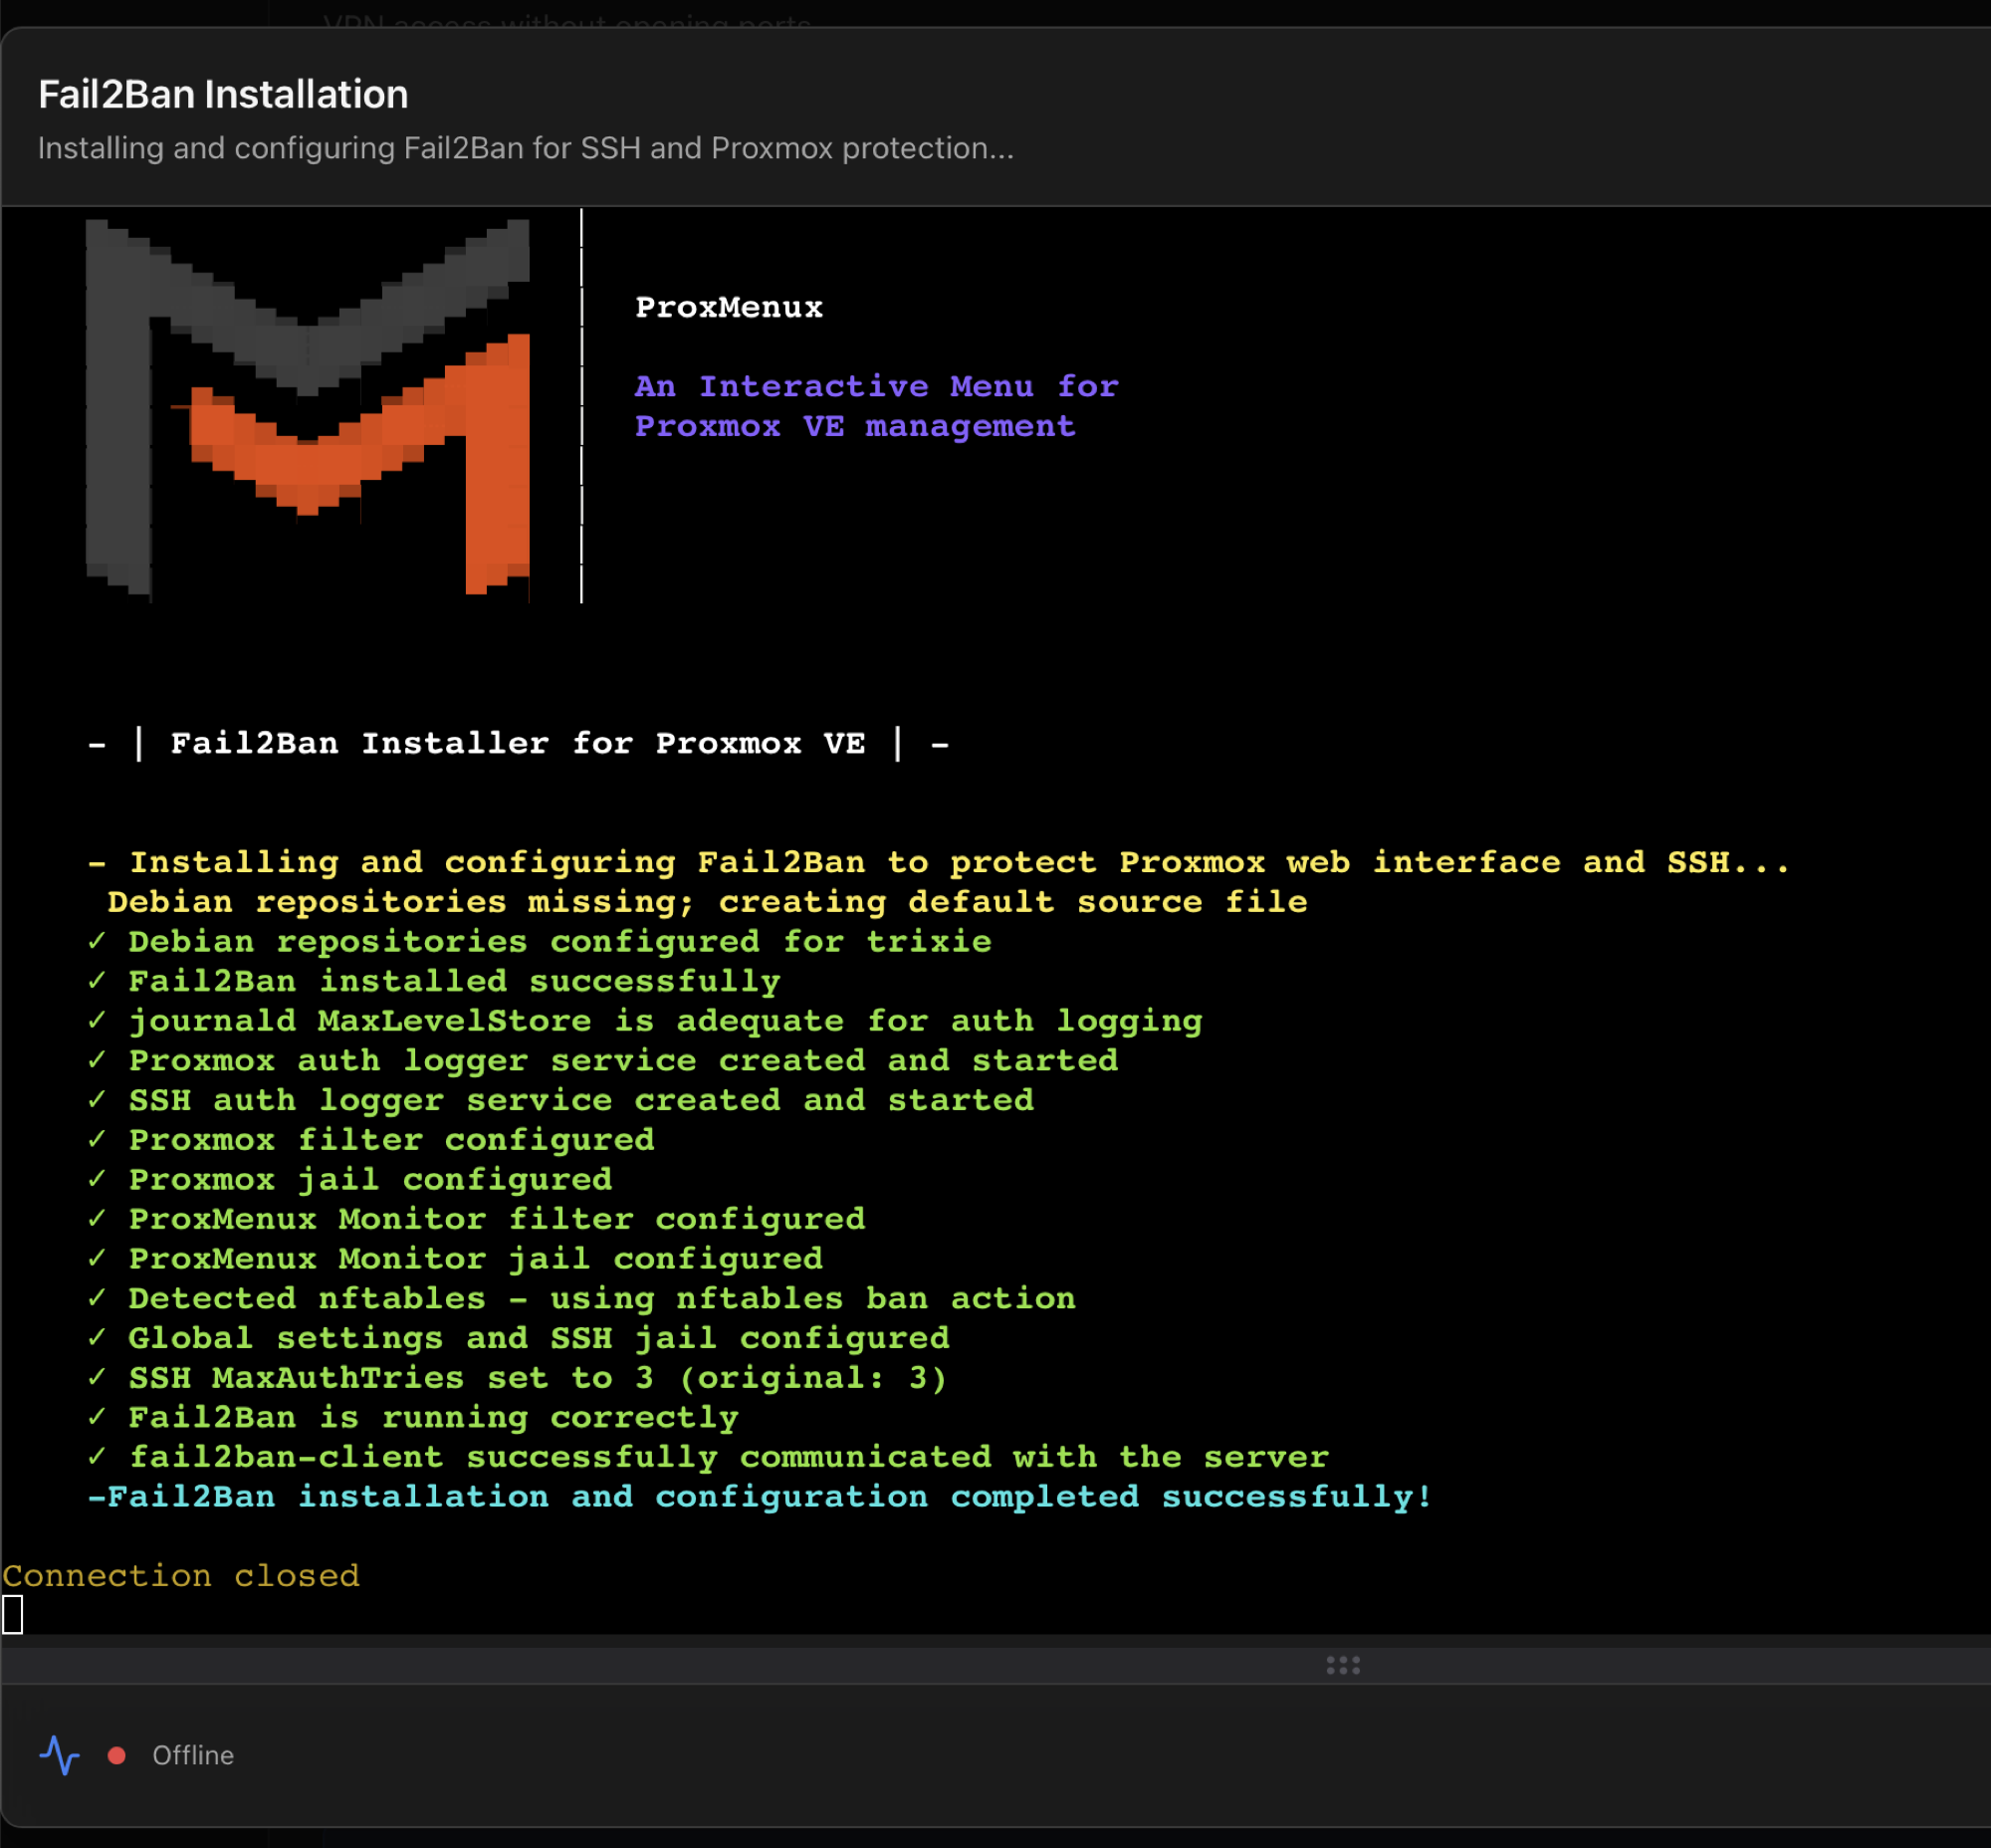
Click Install and Configure Fail2Ban and you get a confirmation modal listing every change the script will make on the host:
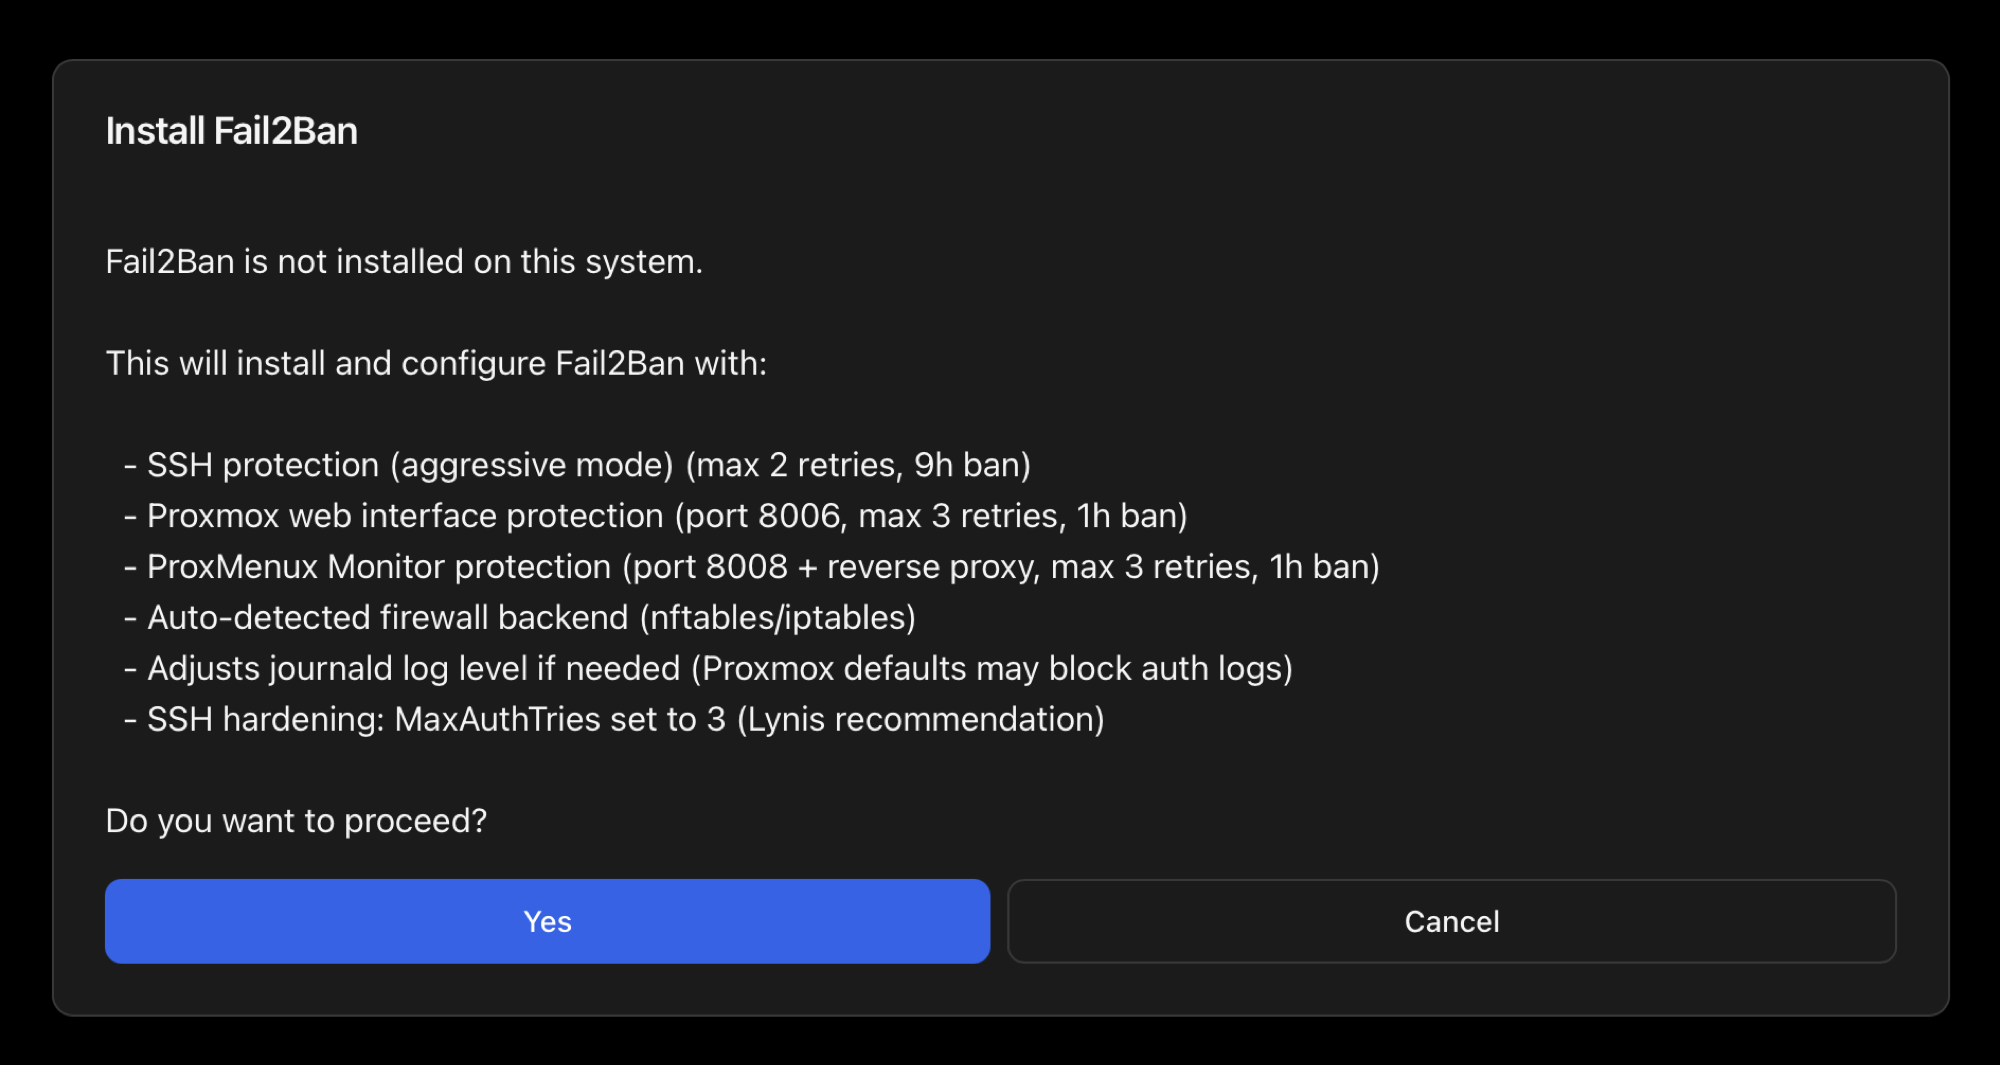
MaxAuthTries=3).Confirmation triggers a streaming install panel (apt + jail config + tests). Same plumbing as the ProxMenux CLI installer.
After install the card flips to the live status view: jails configured, banned IPs counter, recent ban events. The big tabs split Jails & Banned IPs from Recent Activity (the last N entries from the Fail2Ban log).
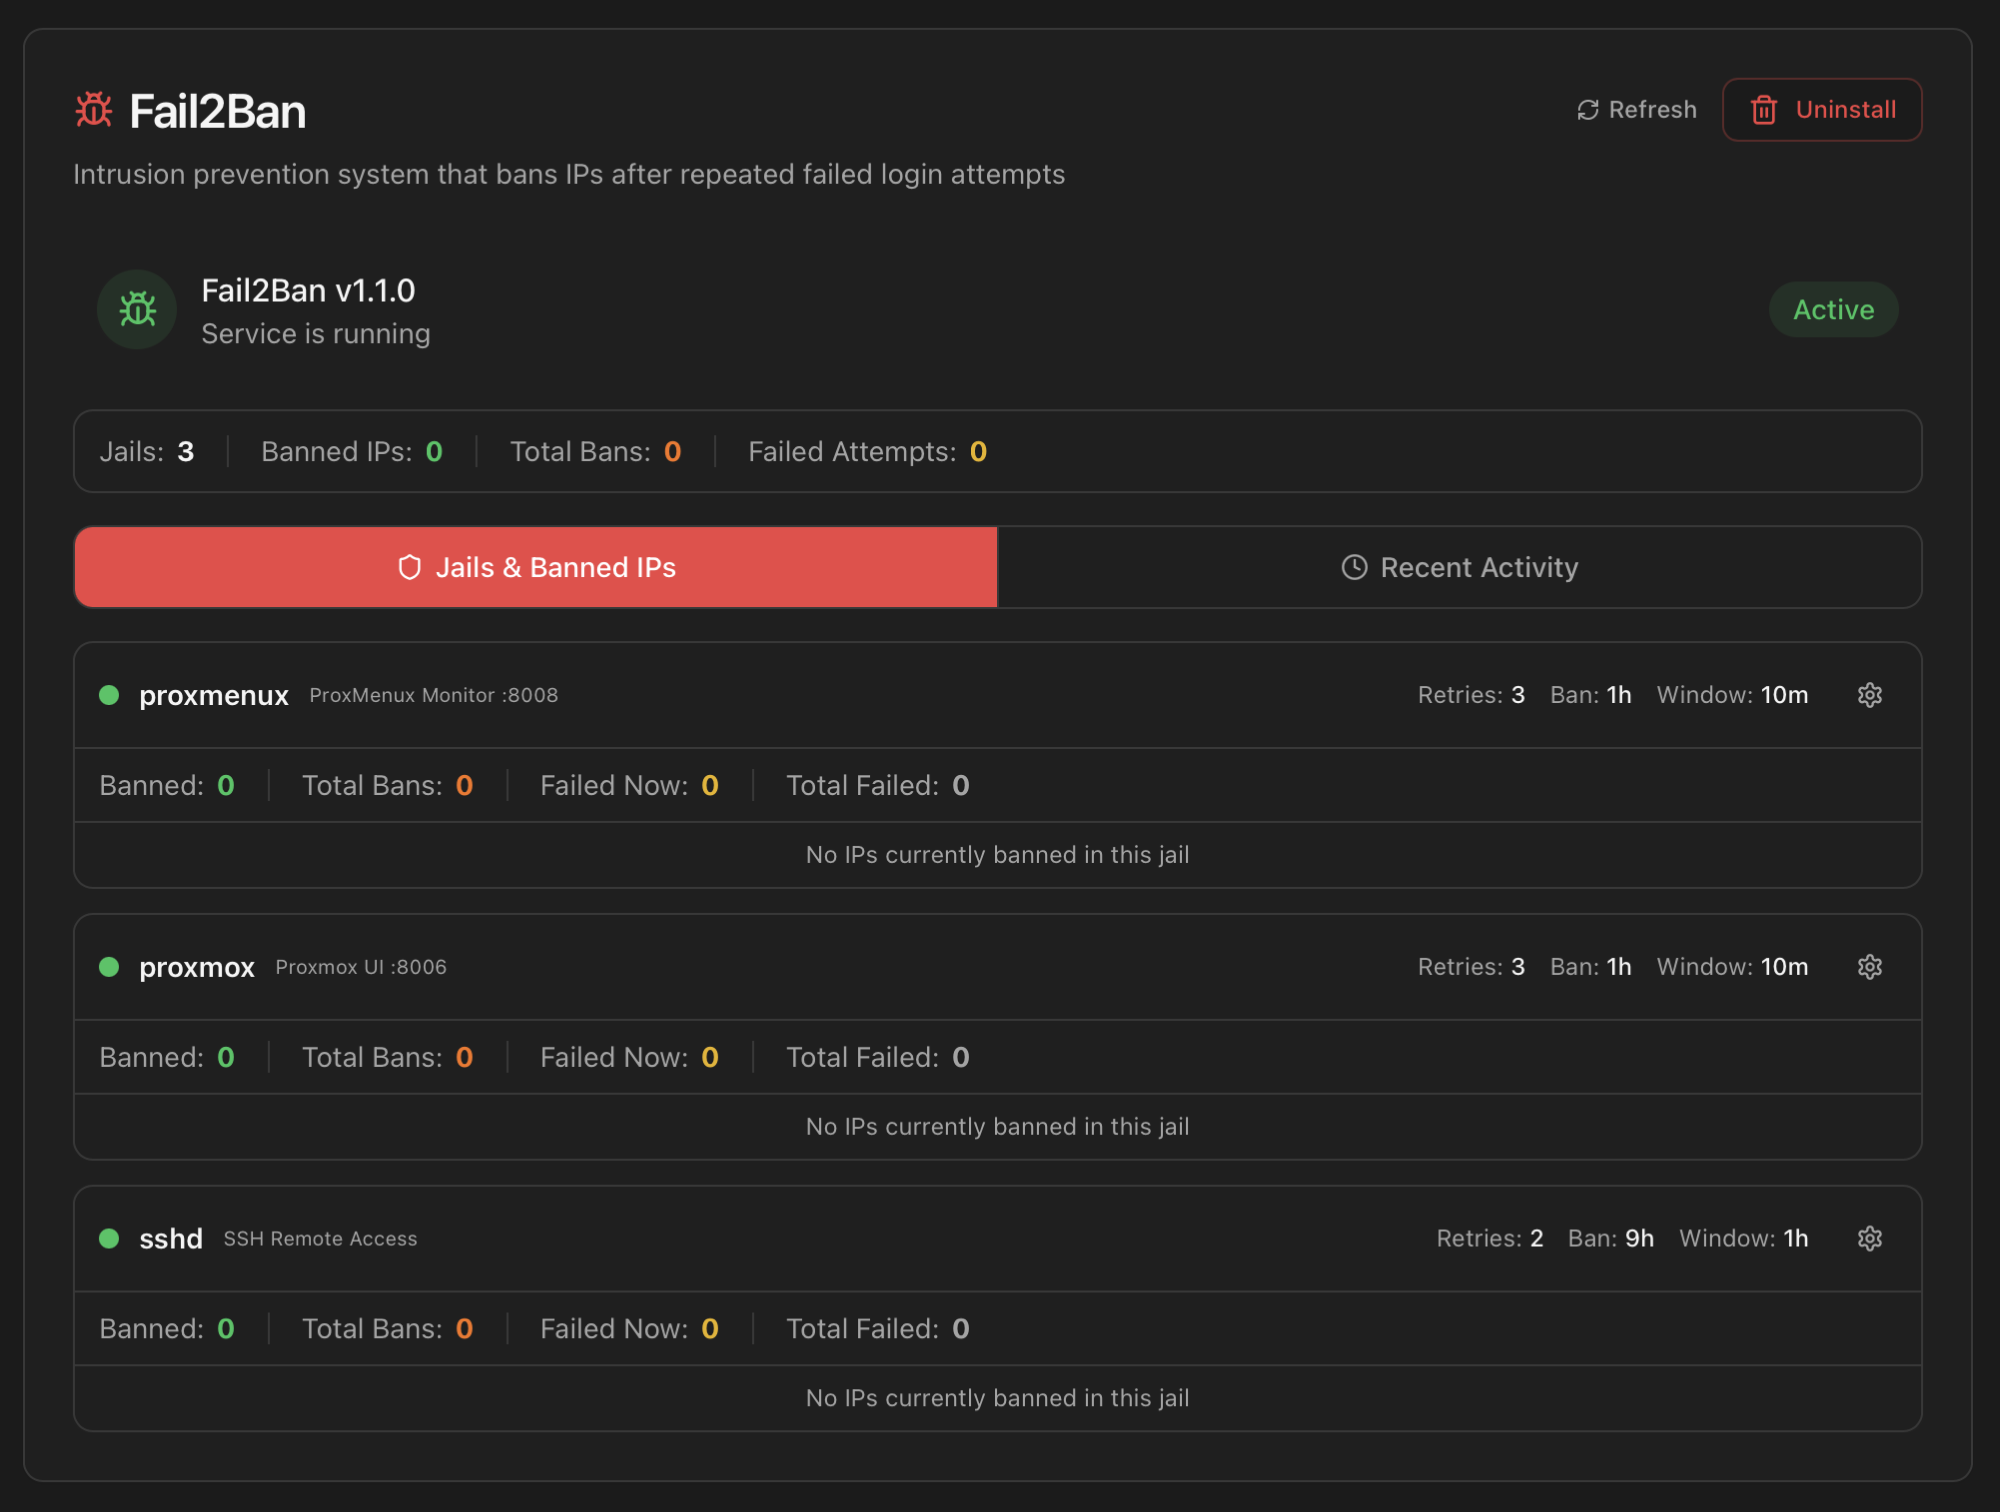
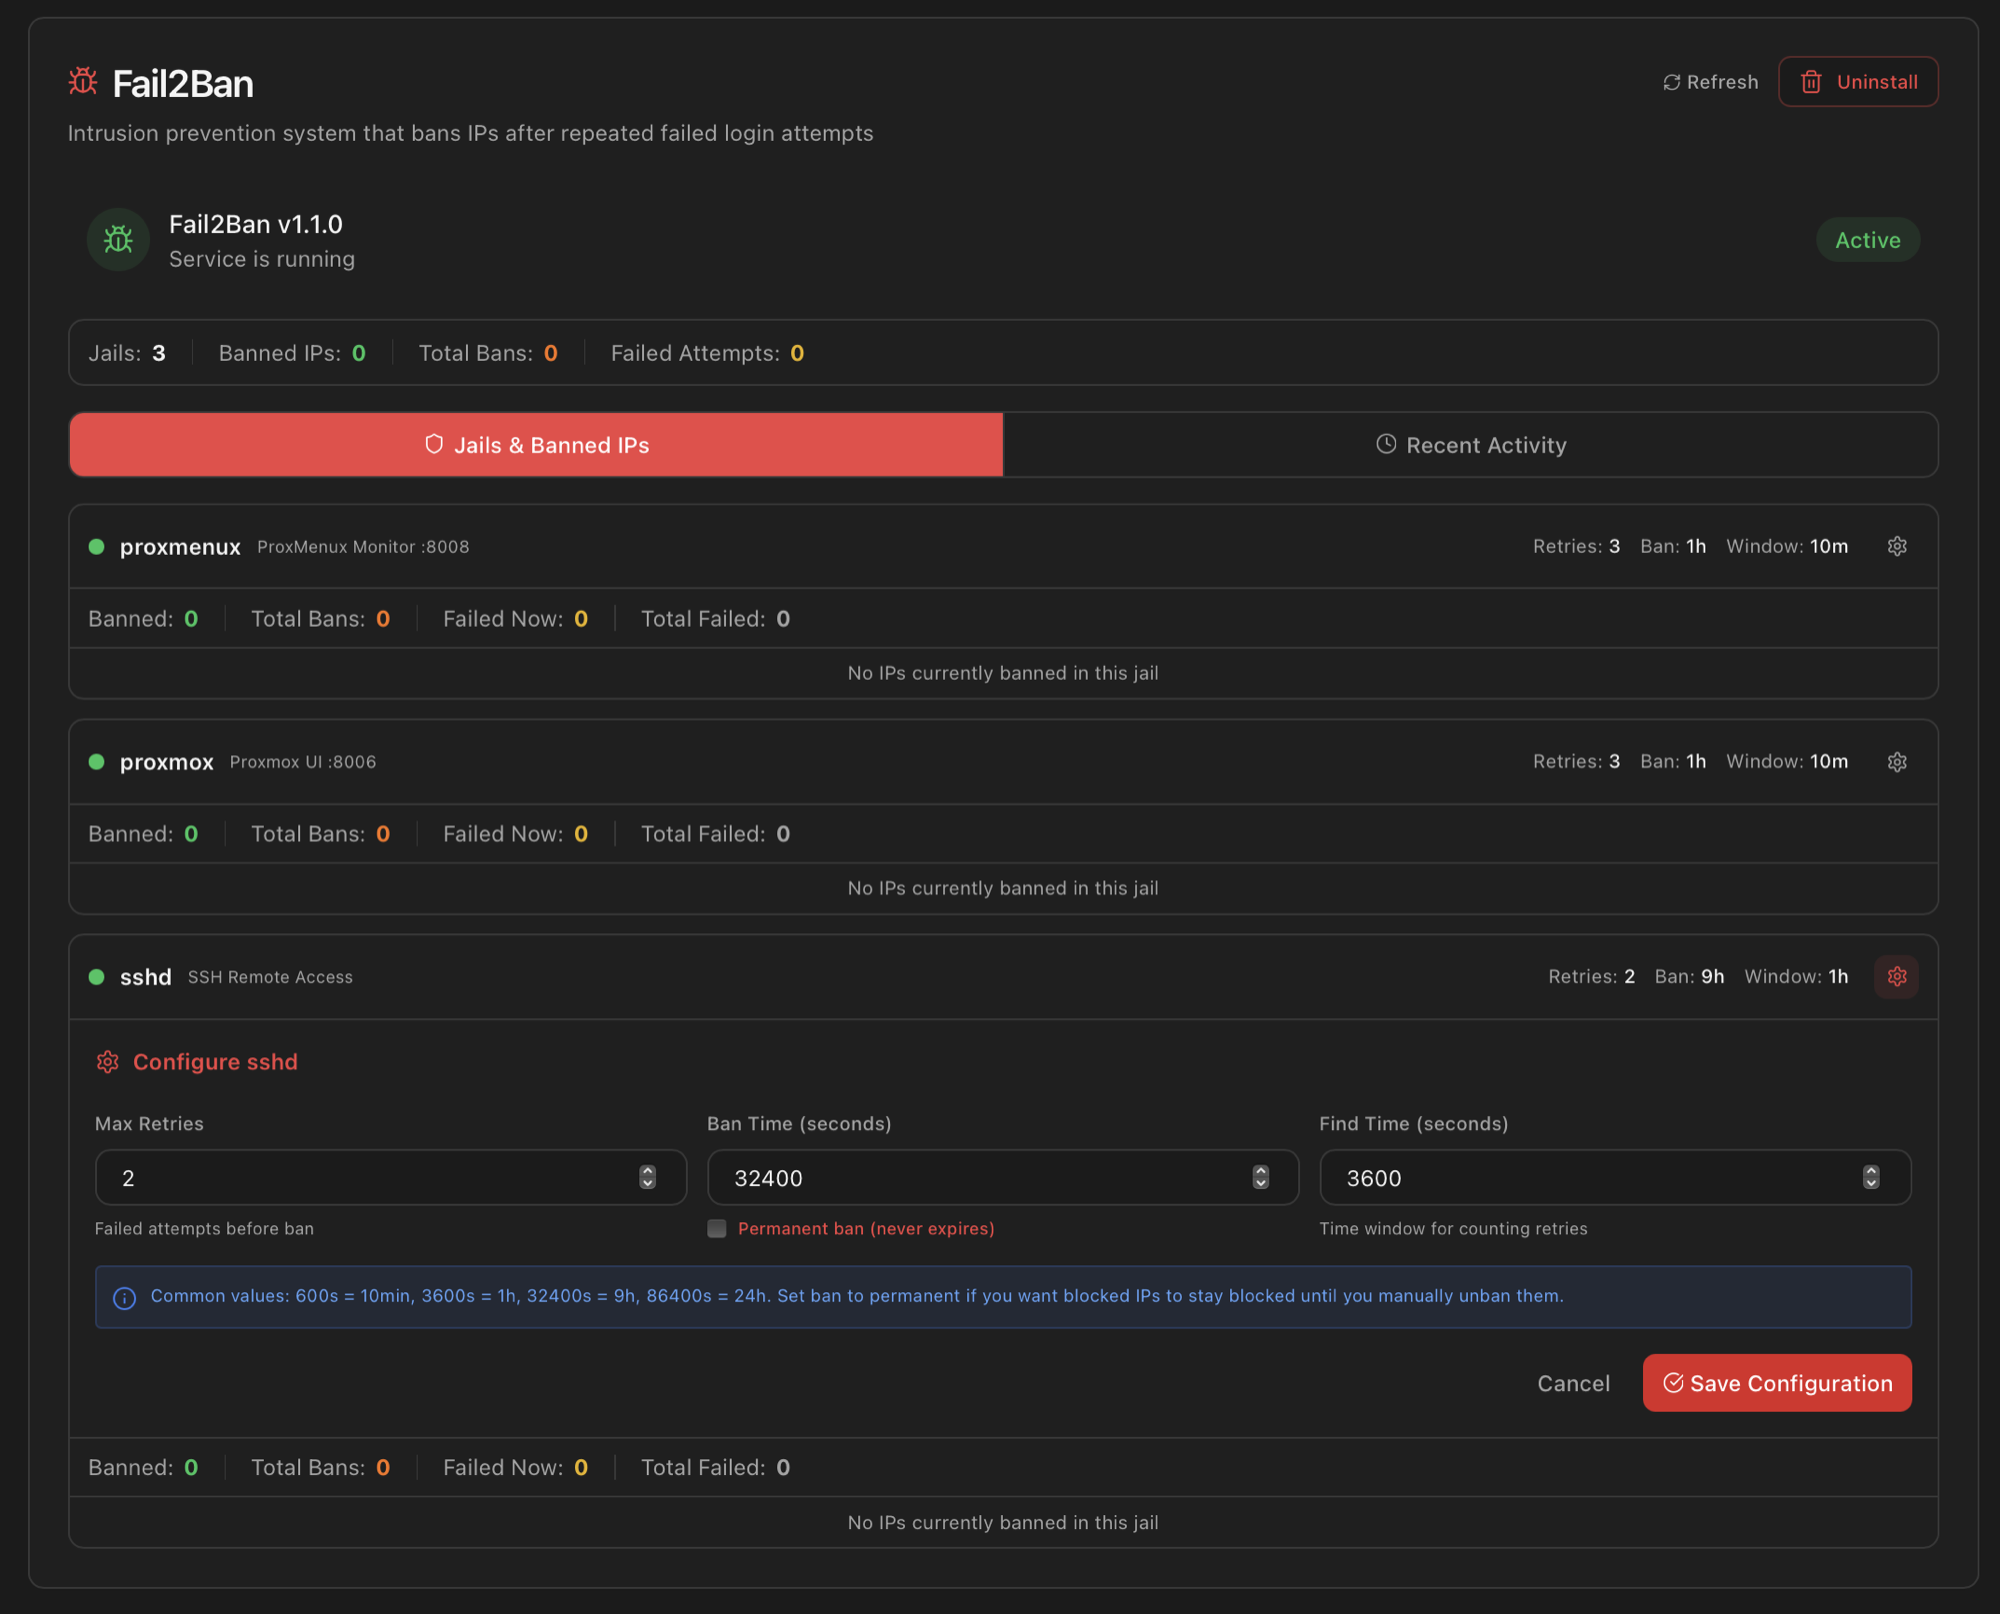
proxmenux, proxmox, sshd) with their retries / ban time / window settings.Tune jail rules. Click the gear icon on any jail row to adjust Max Retries, Ban Time (use a permanent ban if you want offenders blocked until you manually unban) and Find Time (the rolling window for counting retries). Common values are documented inside the form.
The full What it installs / how it's configured / how to uninstall walkthrough — including the manual install path, the SSH MaxAuthTries side effect, and the relationship with the proxmenux-auth.log journal — is in ProxMenux → Security → Fail2Ban.
Without Fail2Ban, brute-force protection is best-effort
proxmenux-auth.log for future inspection but doesn't actively block IPs.Lynis Security Audit (conditional)
What it is. Lynis is an open-source security auditing tool that runs ~280 tests across the host (file permissions, kernel hardening, SSH config, package vulnerabilities, crypto policy, scheduled tasks, banner grabbing, etc.) and produces a hardening score 0–100, a list of warnings and a list of suggestions. It's the de-facto baseline for "is this server in good shape" on Debian-based servers.
Why it's useful. Knowing the security posture of your server is hard to do by reading config files one by one. Lynis catches the things that are routinely overlooked: kernel hardening flags missing, weak SSH ciphers enabled, journal not persistent, sudoers NOPASSWD on default accounts, and many more. Re-running it after applying ProxMenux post-install tweaks gives you an objective number for the improvement.
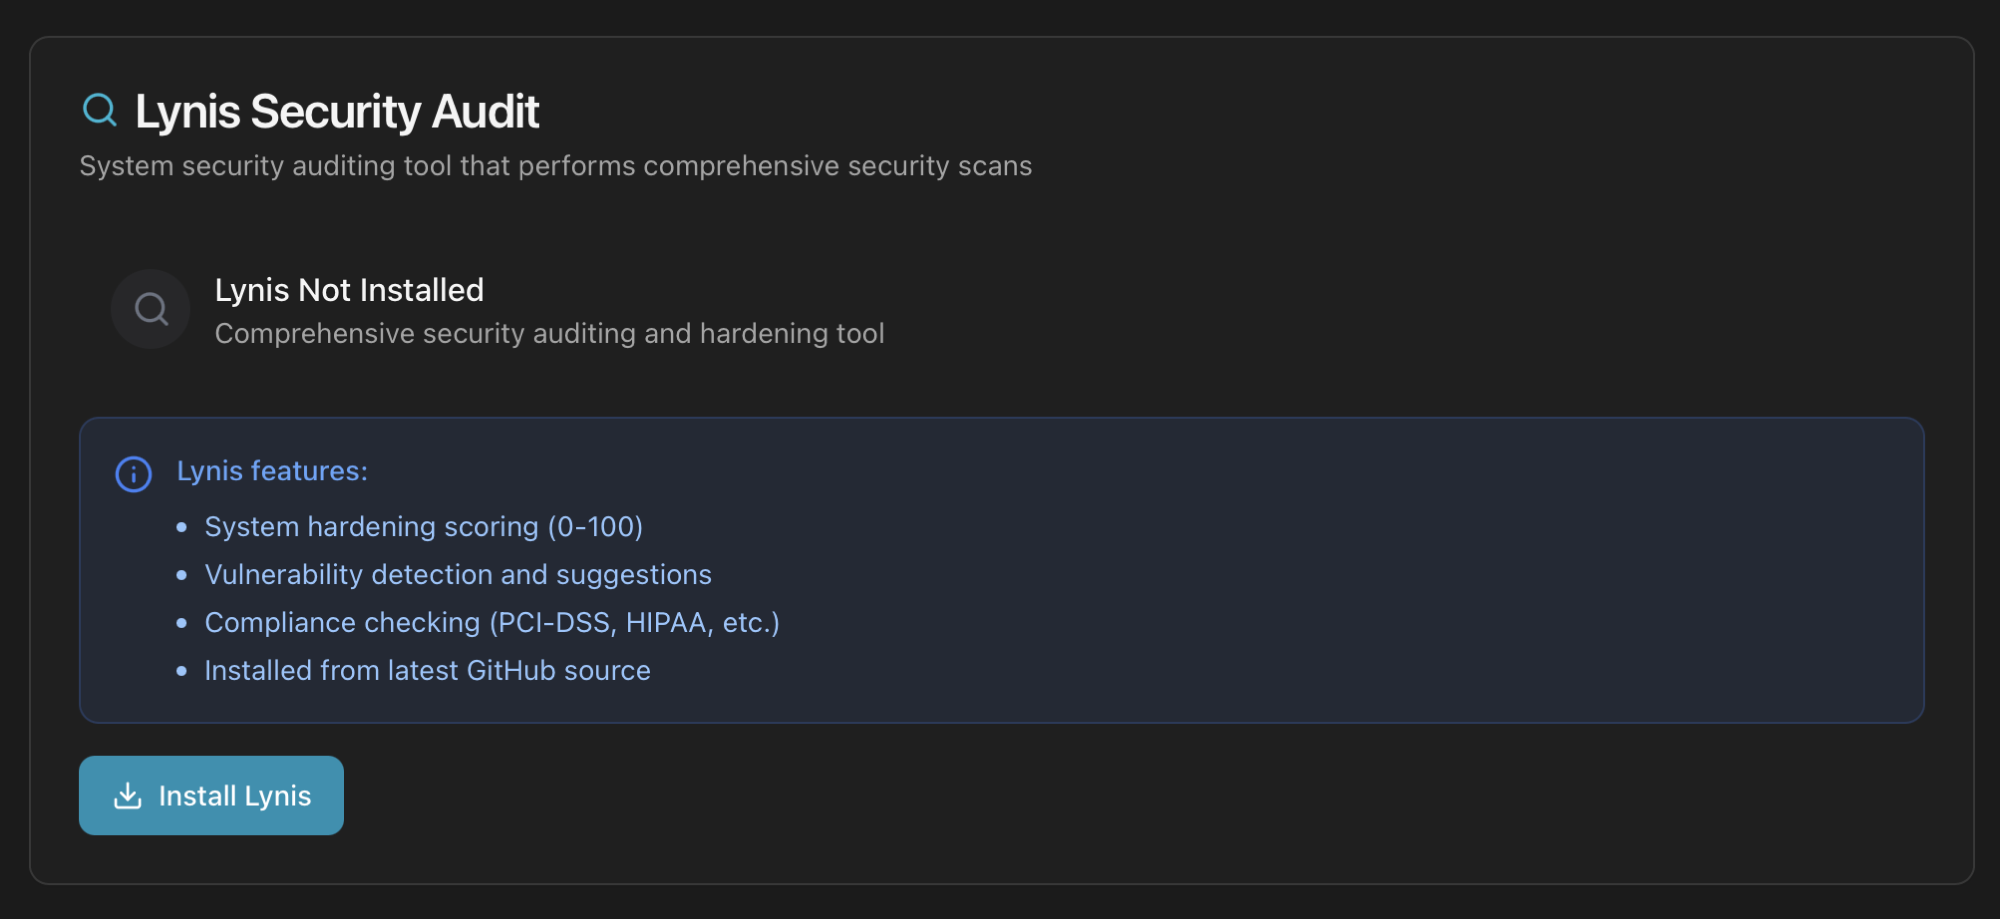
Lynis is also not bundled. ProxMenux installs the latest release directly from the official GitHub source (not the Debian package, which lags several minor versions).
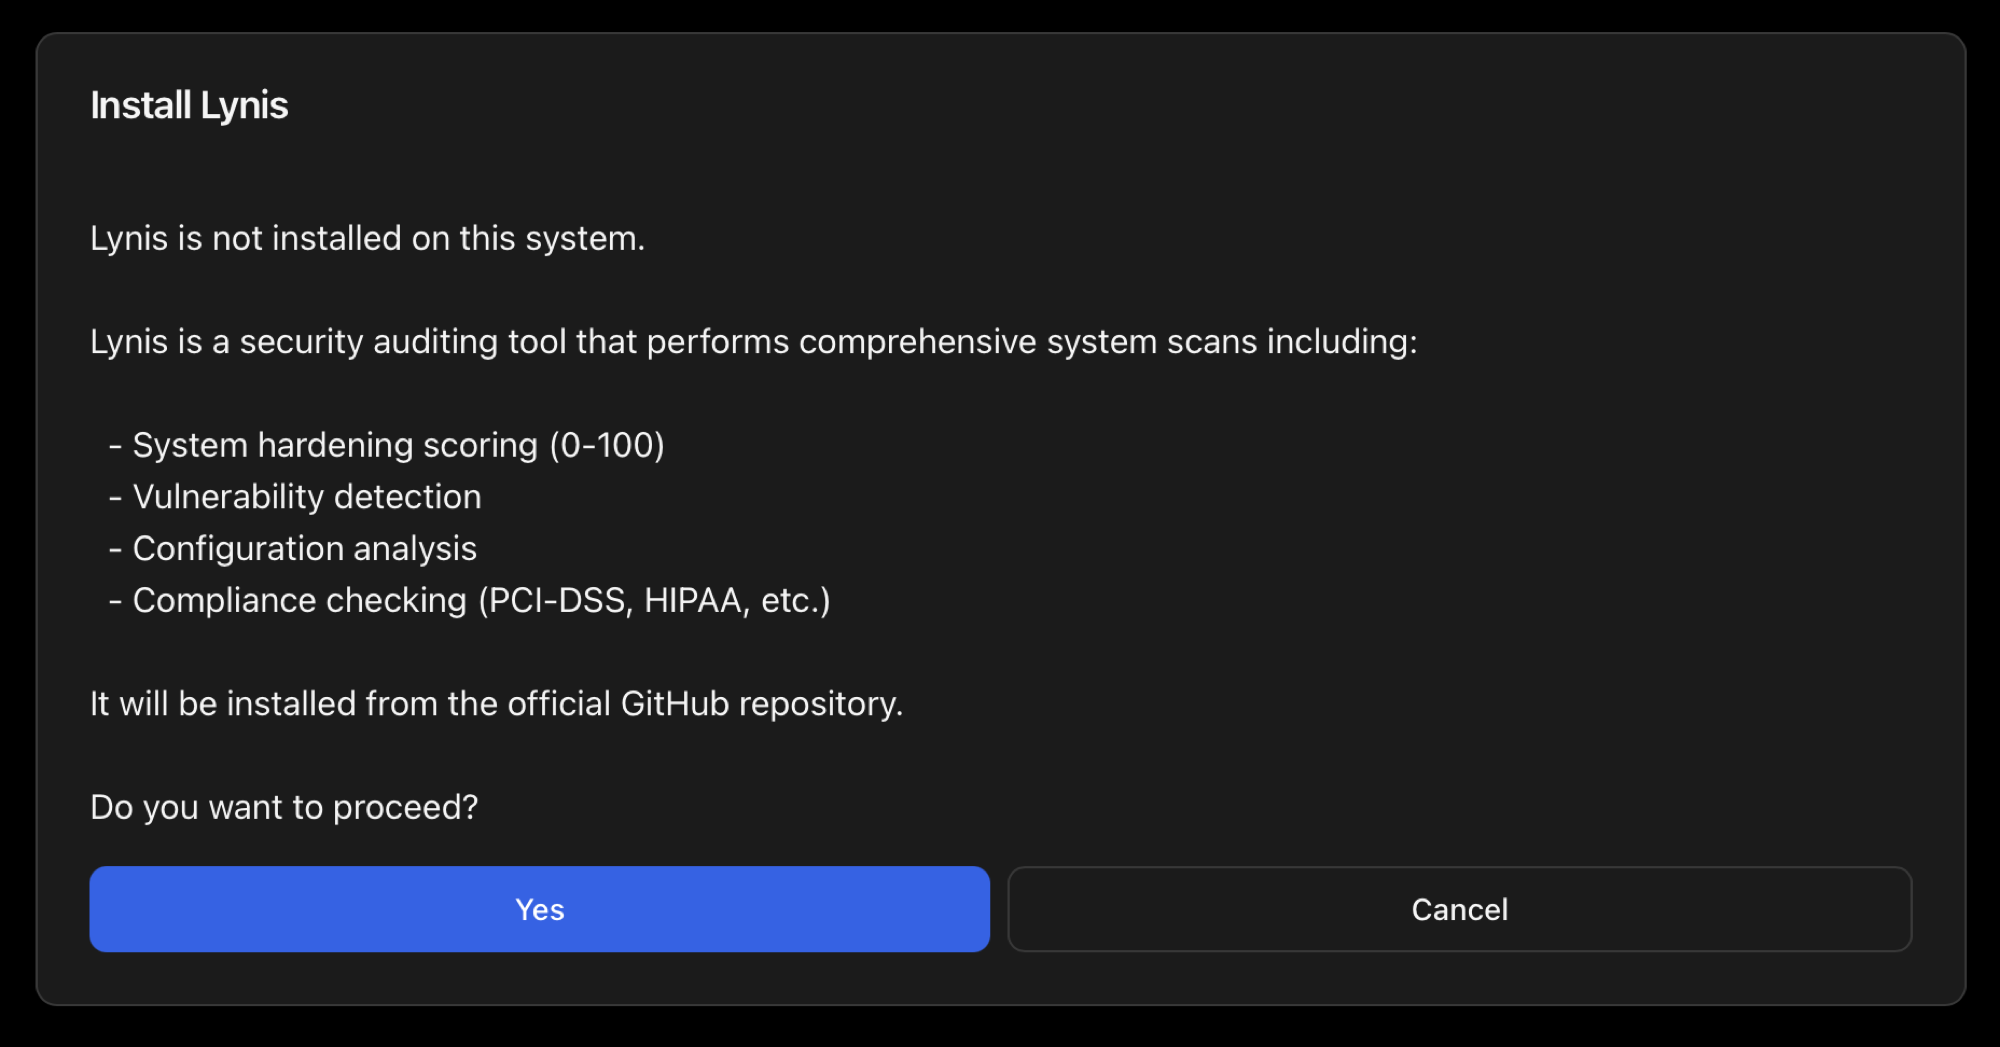
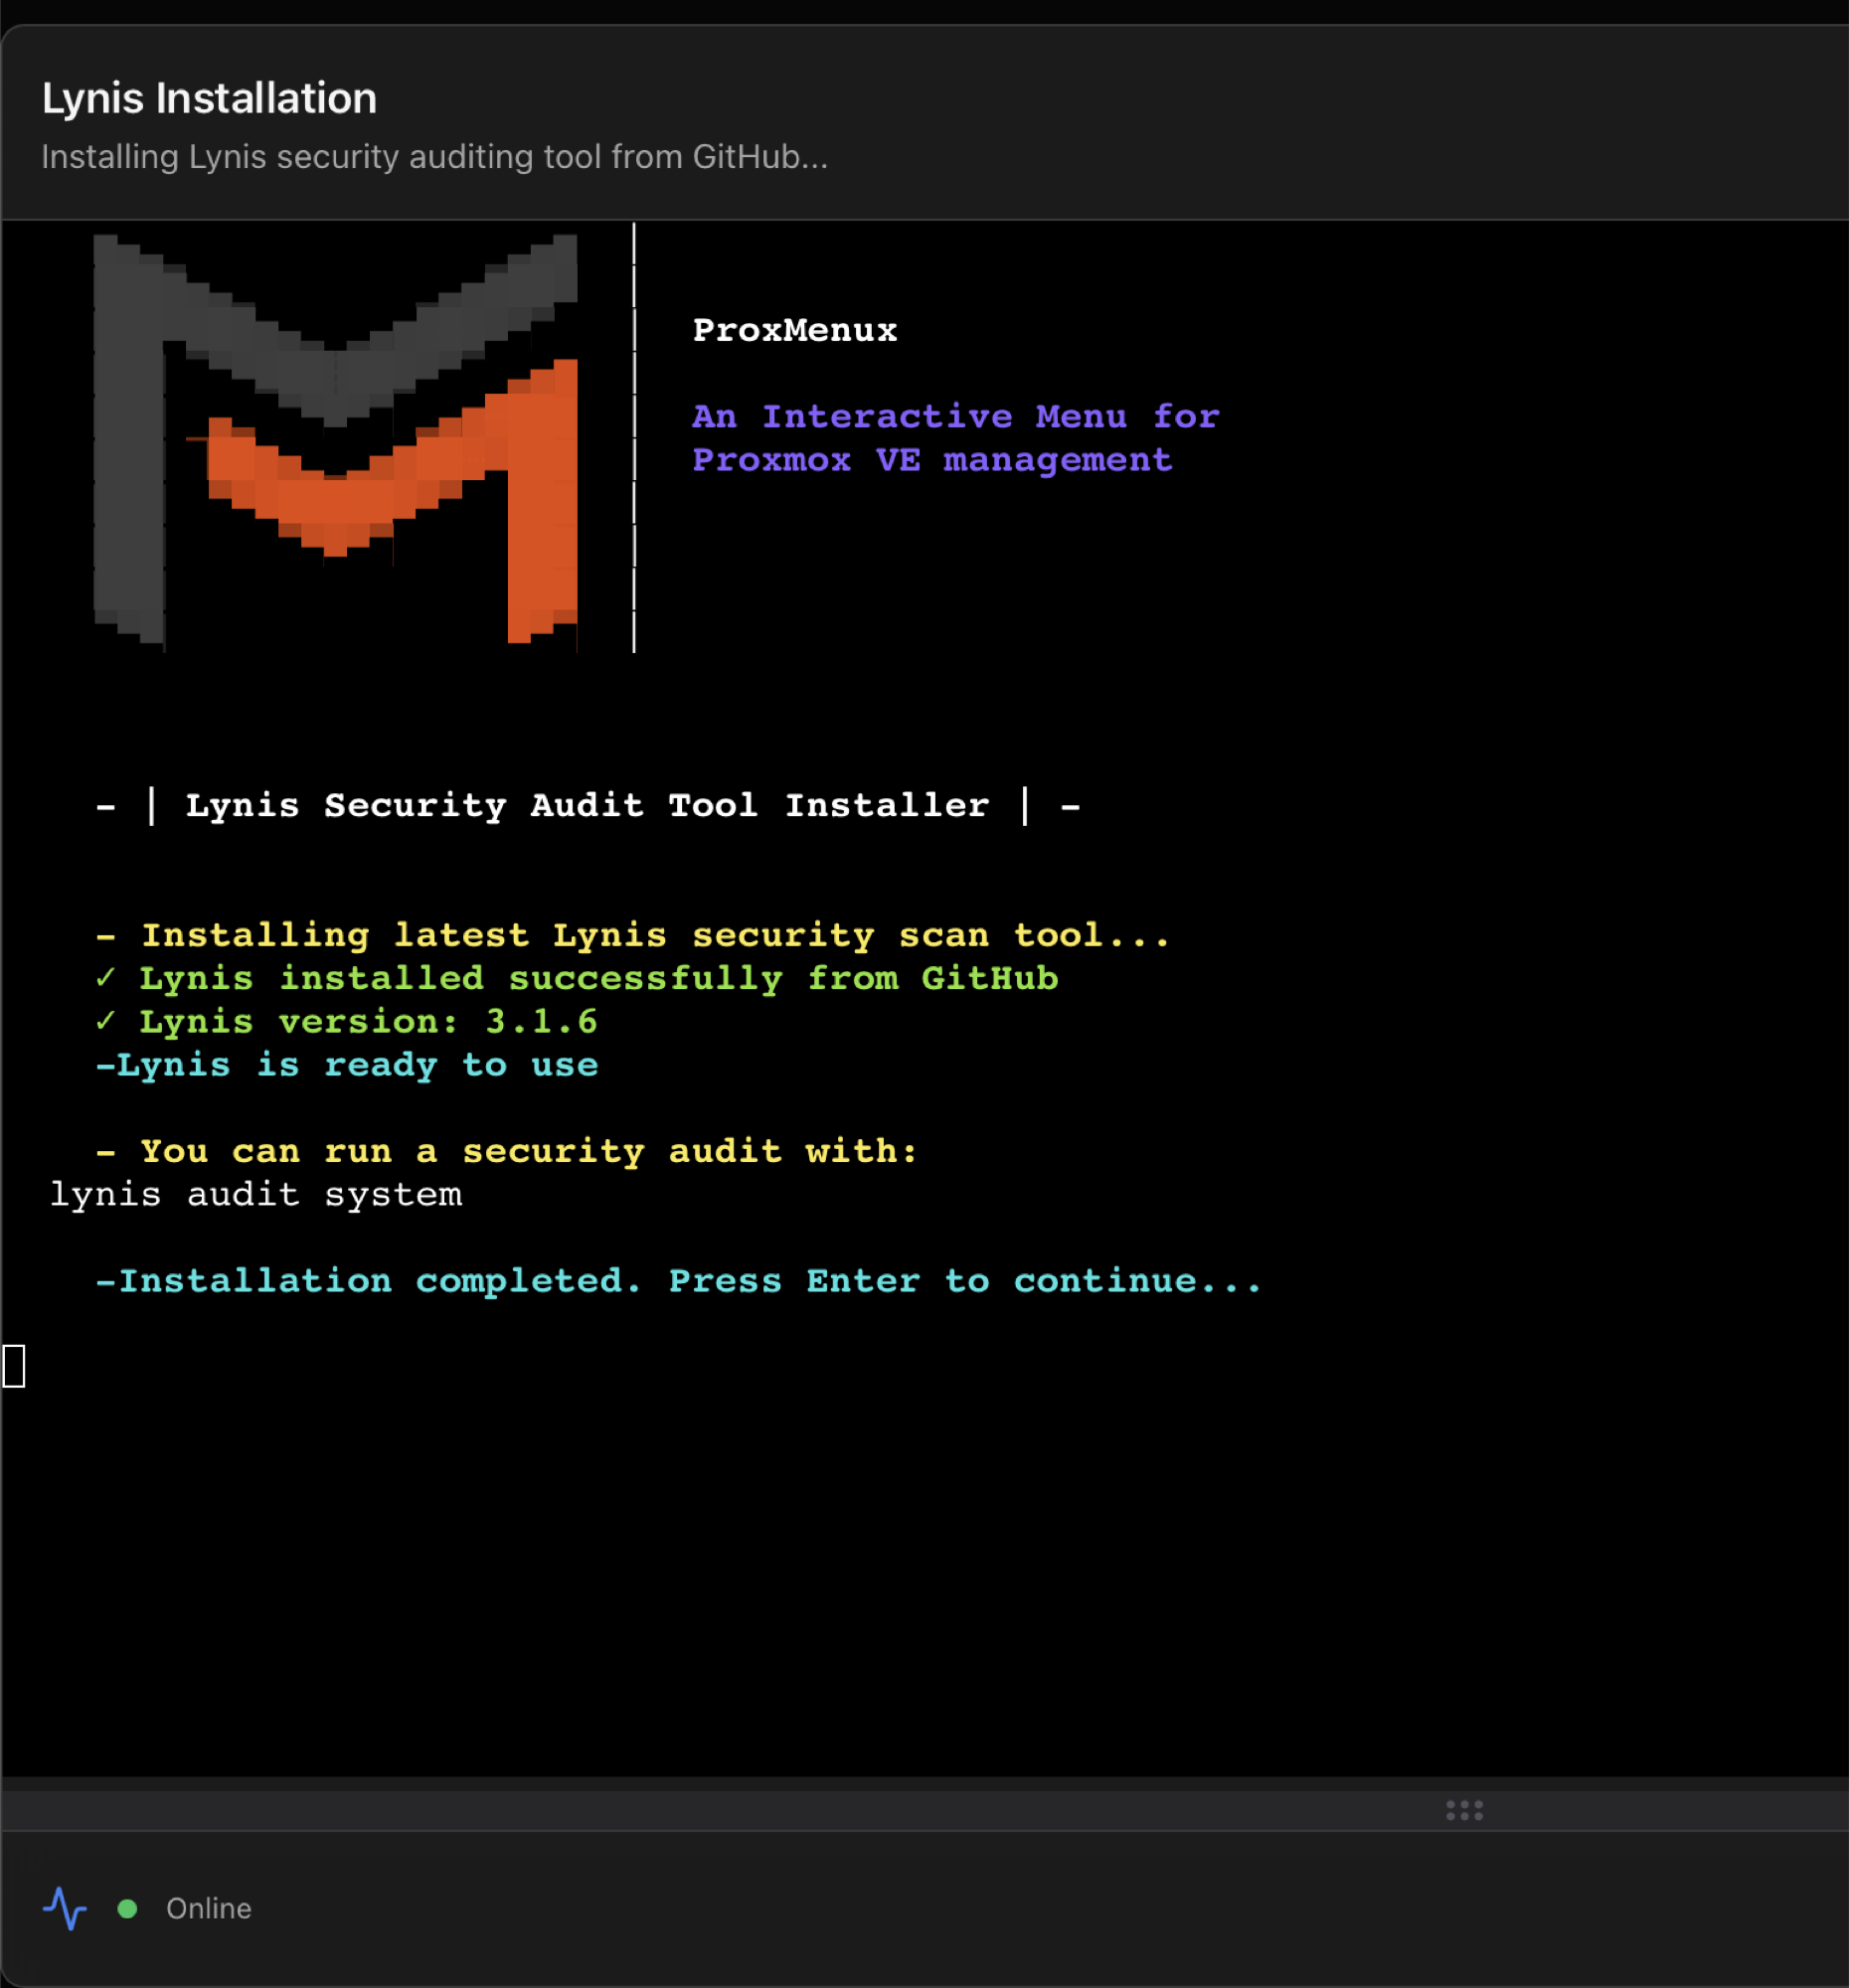
After install the card shows the version and an empty audit history. Click Run Security Audit to start the first scan.
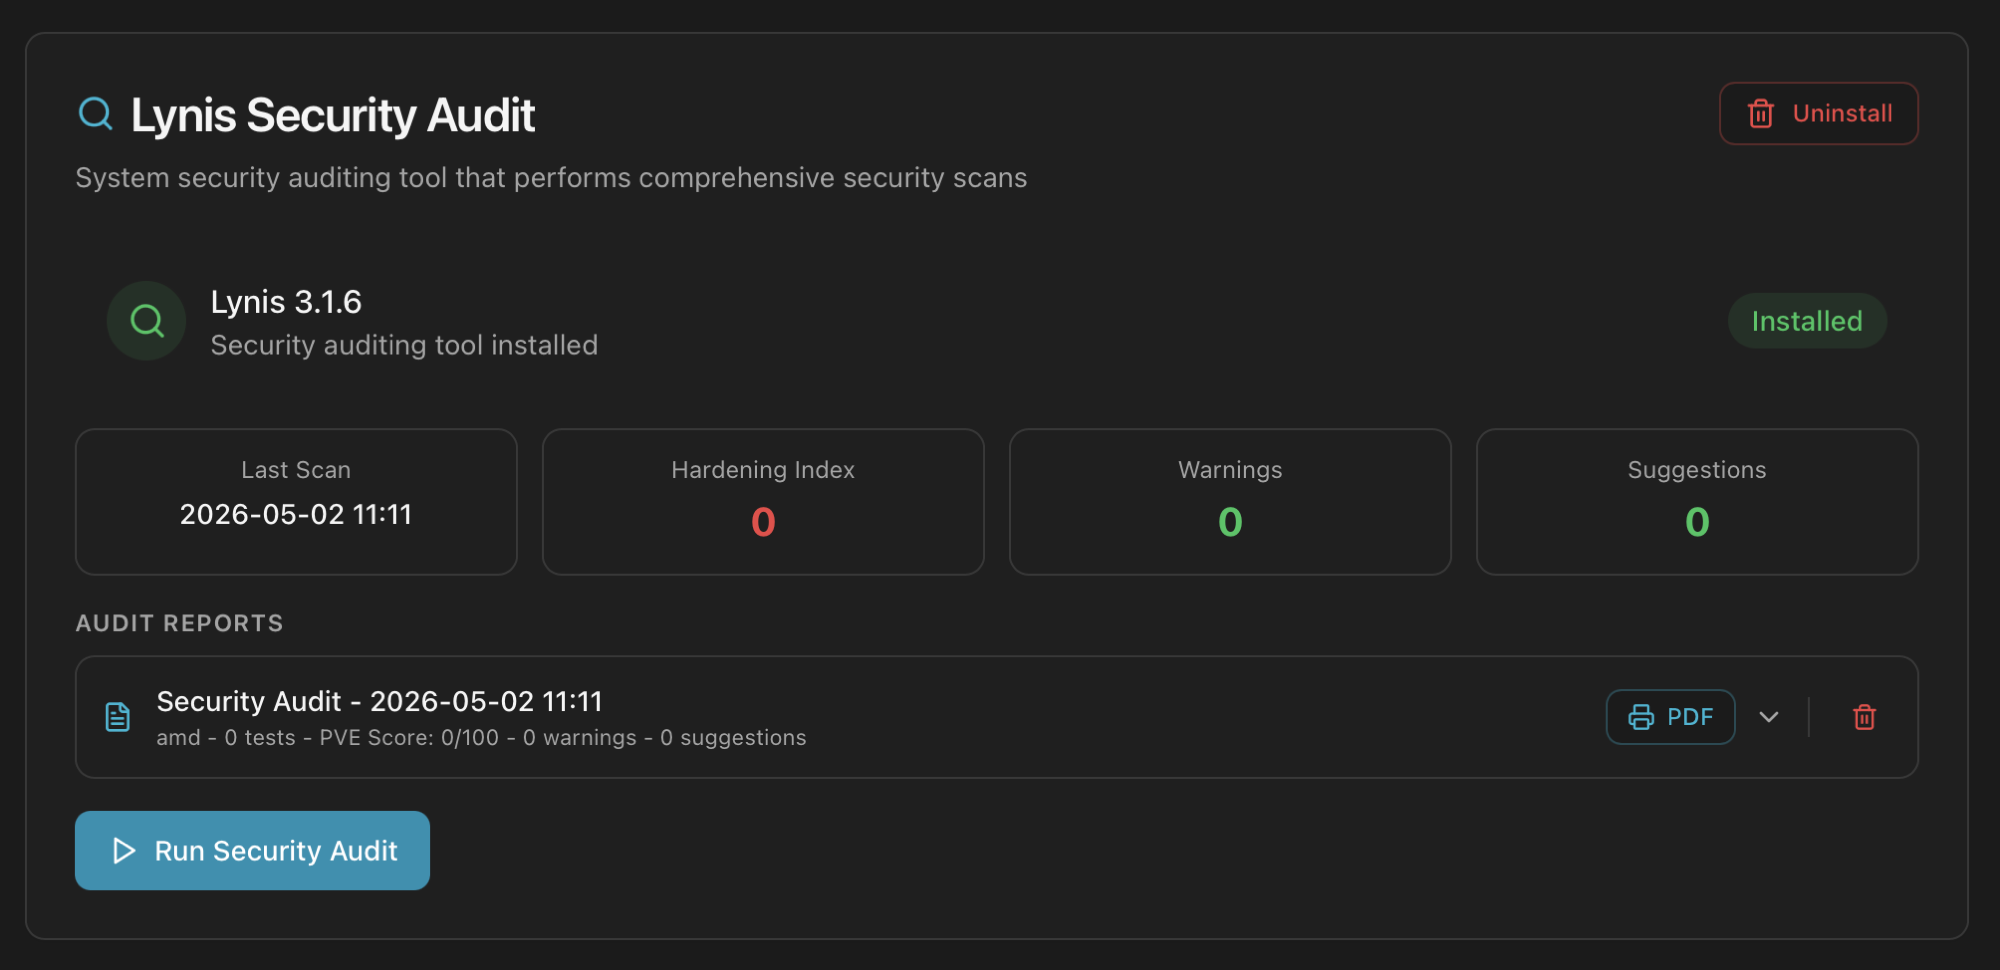
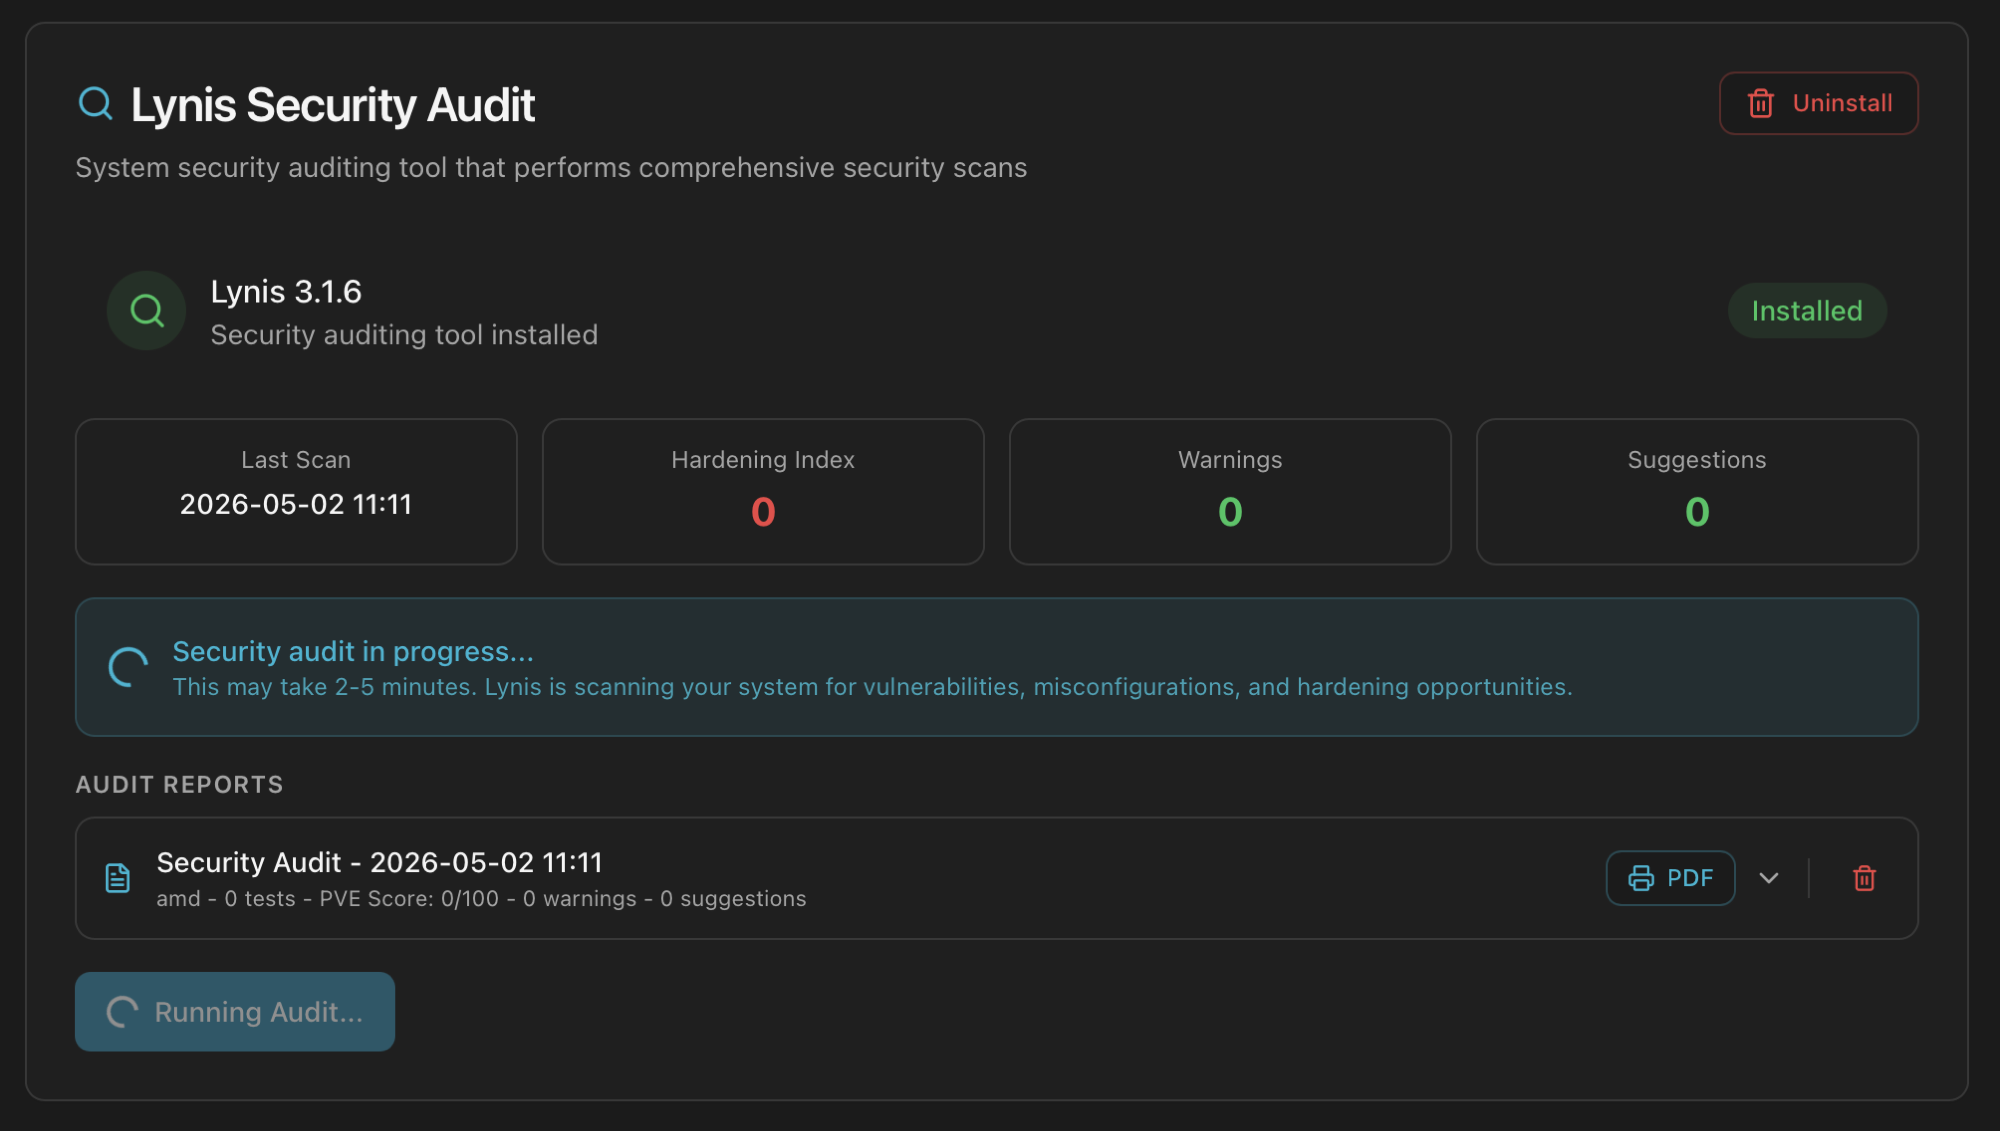
When it finishes, the card flips to the results view: hardening index, warnings, suggestions and an Audit Reports list with each historical scan.
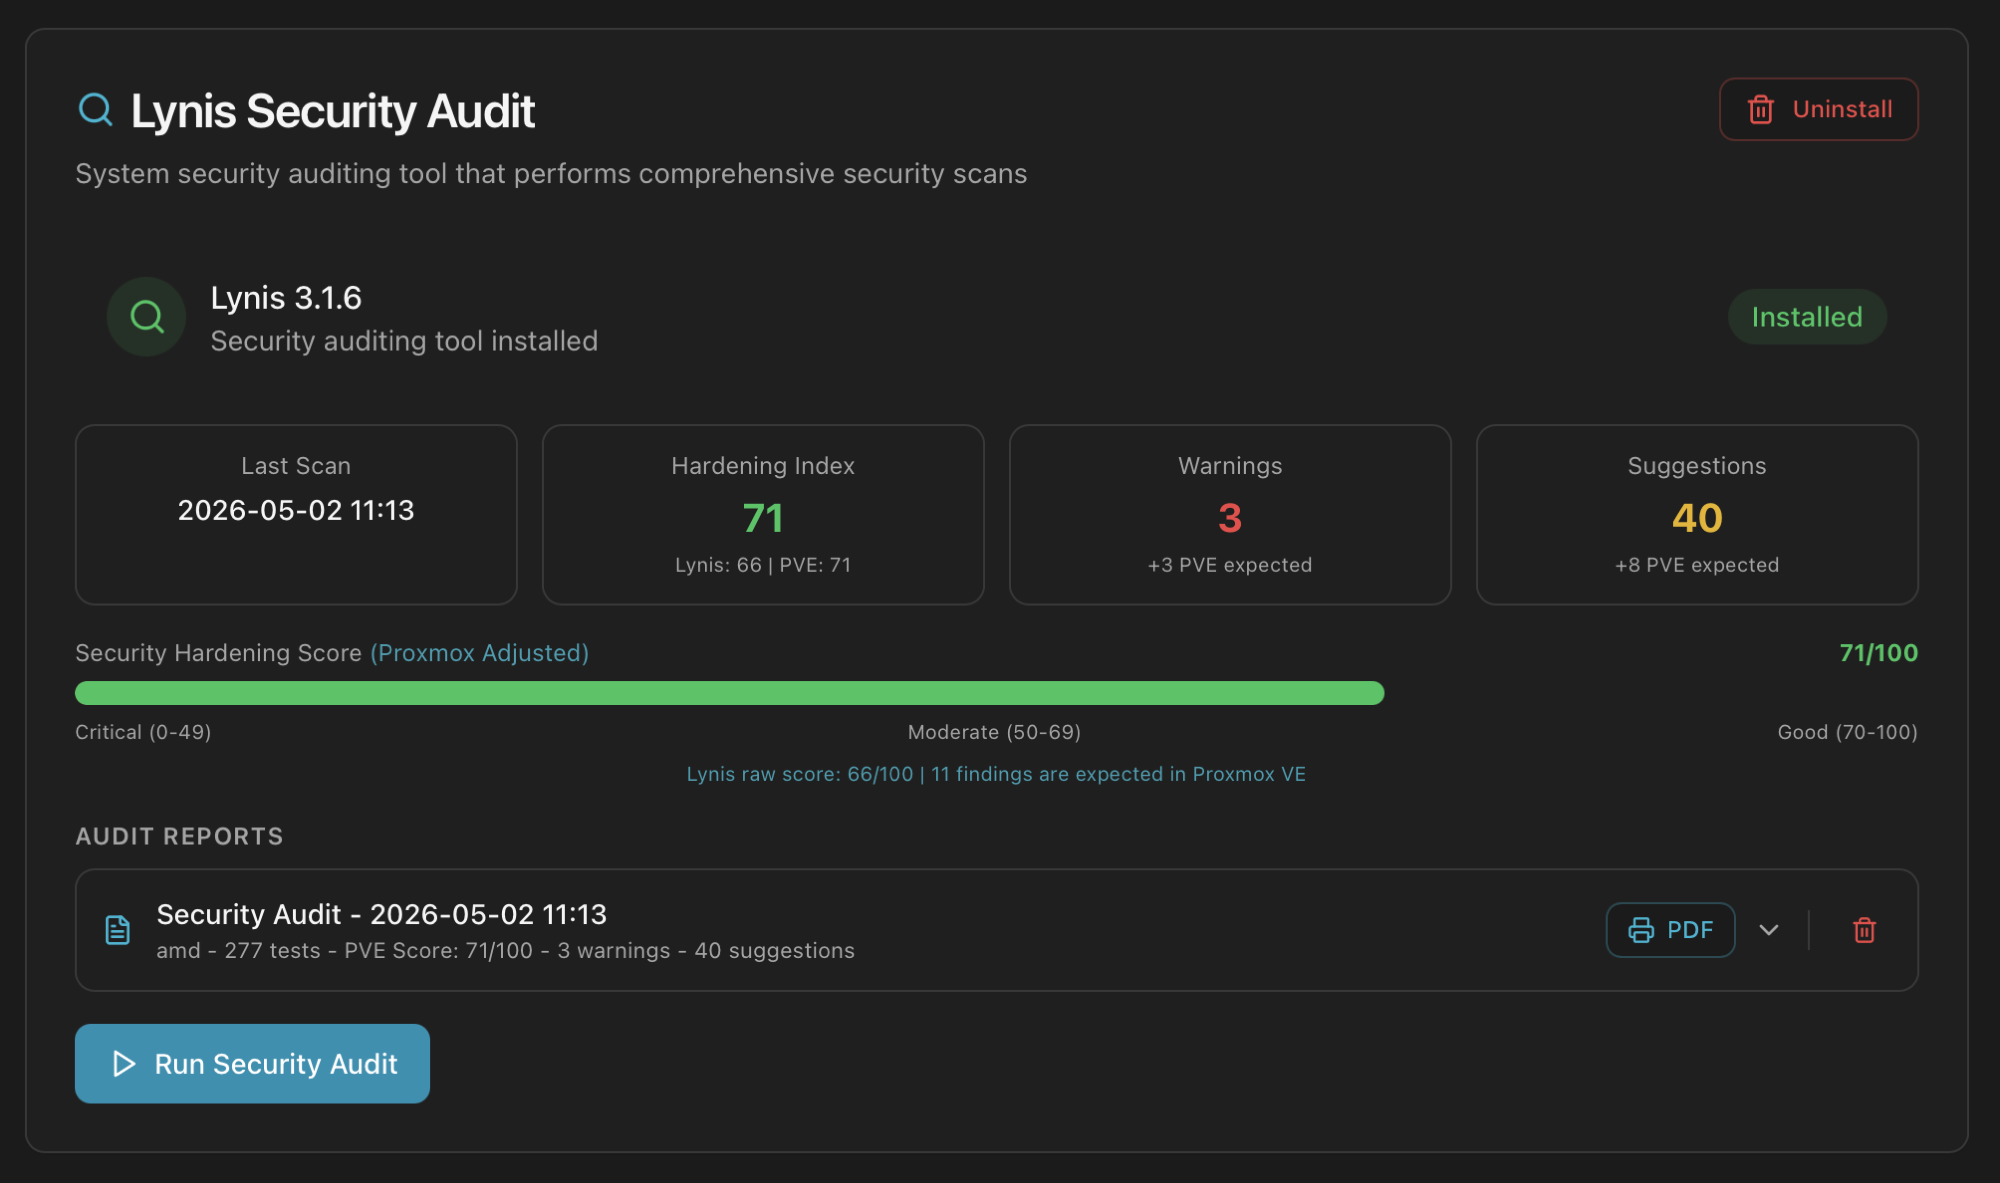
Lynis raw score vs Proxmox-adjusted score
journald tuning, etc.). The card shows both numbers so you can:- Track your Lynis raw score the same way external auditors would.
- Track the Proxmox-adjusted score — a fairer baseline if you're comparing nodes inside the same cluster.
The full report. Each audit row in the list has a PDF button that downloads a multi-page report with the executive summary, system info, security posture, every warning with explanation, every suggestion ranked by impact, and the package inventory. It's the artifact you would attach to a security review.
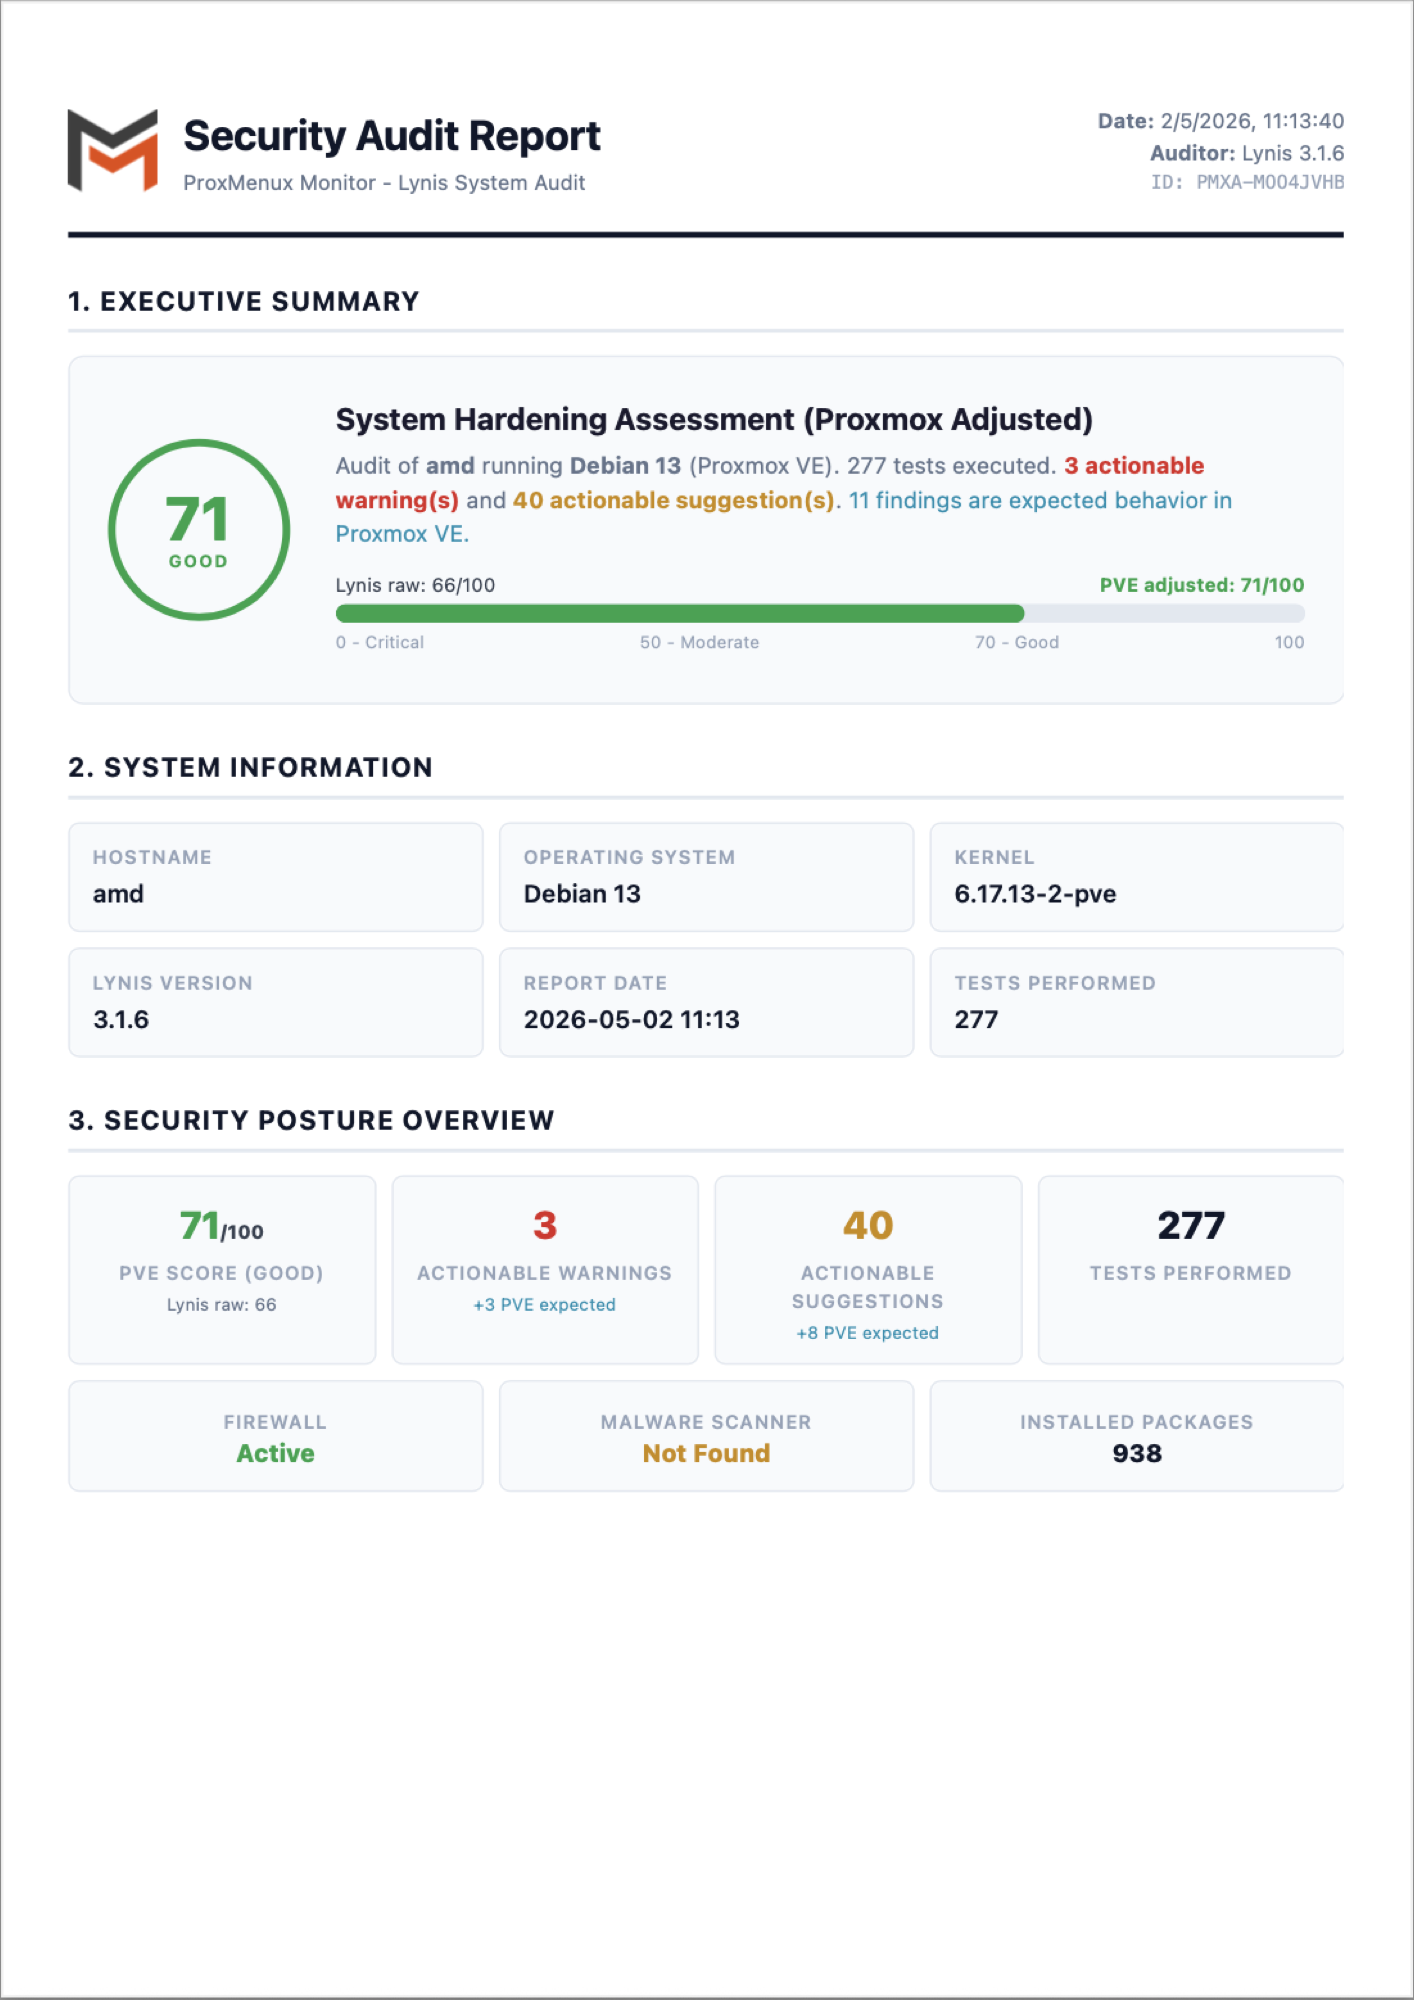
Run the audit periodically (after major Proxmox upgrades, after applying post-install tweaks, before opening a remote-access path) and keep the reports — the trend matters more than any single number.
The full What it installs / how it's configured / how to uninstall walkthrough and a written sample report breakdown are in ProxMenux → Security → Lynis.
How the data is collected
| Card | Endpoint | Source |
|---|---|---|
| Authentication, 2FA, password change | /api/auth/* | Local SQLite + JWT issued by the Monitor. |
| SSL / HTTPS | /api/auth/ssl/* | openssl x509 on /etc/pve/local/pve-ssl.pem + /etc/proxmenux/ssl_config.json. |
| API tokens list / mint / revoke | /api/auth/api-tokens | Token rows kept locally; nothing leaves the host. |
| Secure Gateway (deploy + status) | /api/oci/* | Provisions Alpine LXC + tailscaled via pct create / pct exec. |
| Firewall status & rules | /api/security/firewall/* | pve-firewall + /etc/pve/firewall/<cluster|host>.fw. |
| Fail2Ban (only when installed) | /api/security/fail2ban/* | fail2ban-client status, /var/log/fail2ban.log, /etc/fail2ban/jail.local. |
| Lynis audit (only when installed) | /api/security/lynis/* | Runs lynis audit system in the background; report parsed from /var/log/lynis-report.dat. |
# Confirm the auth log on the host (used by Fail2Ban + audit)
journalctl -t proxmenux-auth --since '7 days ago' | tail

# Cross-check the firewall rules the dashboard sees
pve-firewall status
cat /etc/pve/firewall/host.fw

# Verify Fail2Ban (only if installed)
fail2ban-client status
fail2ban-client status sshd

# Verify Lynis (only if installed)
lynis show version
ls -lh /var/log/lynis-report.dat
Where to next
- Access & Authentication — full first-launch flow, 2FA app picker, lost-authenticator recovery, reverse-proxy snippets.
- Integrations — cookbooks for using API tokens with Homepage, Home Assistant, Prometheus, n8n and the Secure Gateway end-to-end.
- API Reference — every
/api/auth,/api/securityand/api/ociendpoint with method, body and curl examples. - ProxMenux → Security → Fail2Ban — install walkthrough, jails configured, manual install path.
- ProxMenux → Security → Lynis — sample report, score interpretation, when to re-run.